Capture, transform and deliver events published by Amazon Security Lake to the Amazon OpenSearch Service

With the recent introduction of Amazon Security Lake, accessing all your security-related data in one place has never been easier. Whether it's findings from AWS Security Hub, DNS query data from Amazon Route 53, network events such as VPC flow logs, or third-party integrations provided by partners such as Barracuda Email Protection, Cisco Firepower Management Center or Okta identity logs, you now gain a centralized environment where you can correlate events and findings using a wide range of tools in AWS and the partner ecosystem.
Security Lake automatically centralizes security data from cloud sources, both local and custom, in a specially created data lake stored in your account. With Security Lake, you can get a complete view of security data across your organization and improve the protection of your workloads, applications, and data. Security Lake has adopted the Open Cybersecurity Schema Framework (OCSF), an open standard. With OCSF support, the service can normalize and combine security data from AWS and a wide range of enterprise security data sources.
When it comes to analysing the data coming into Security Lake in near real-time and responding to the security events your business cares about, the Amazon OpenSearch service provides the necessary tools to help you understand the data.
The OpenSearch service is a fully managed and scalable log analytics framework that customers use to capture, store and visualize data. Customers use the OpenSearch service for various data sets, including healthcare data, financial transaction information, application performance data, observability data, and more. In addition, customers use the managed service for its sourcing efficiency, scalability, low query latency, and ability to analyze large data sets.
This article shows how to acquire, transform, and deliver Security Lake service data to the OpenSearch service for use by SecOps teams. The authors also guide you through using a series of pre-built visualizations to view events across multiple AWS data sources provided by Security Lake.
Understanding the event data found in Security Lake
Security Lake stores standardized OCSF security events in the Apache Parquet format - an optimized, columnar data storage format with efficient data compression and enhanced performance for bulk handling complex data. The Parquet format is the primary format in the Apache Hadoop ecosystem and is integrated with AWS services such as Amazon Redshift Spectrum, AWS Glue, Amazon Athena, and Amazon EMR. It is a portable columnar format, adapted to support additional encodings as technology evolves, and supports multiple languages such as Python, Java, and Go. And the best part is that Apache Parquet is open-source!
OCSF intends to provide a common language for data scientists and analysts to use for threat detection and research. With diverse sources, you can build a complete picture of your security state on AWS using Security Lake and the OpenSearch service.
Understanding the event architecture for the Security Lake service
Security Lake provides a subscriber framework that accesses data stored in Amazon S3. Services such as Amazon Athena and Amazon SageMaker use query access. The solution described in this article uses data access to respond to events generated by Security Lake.
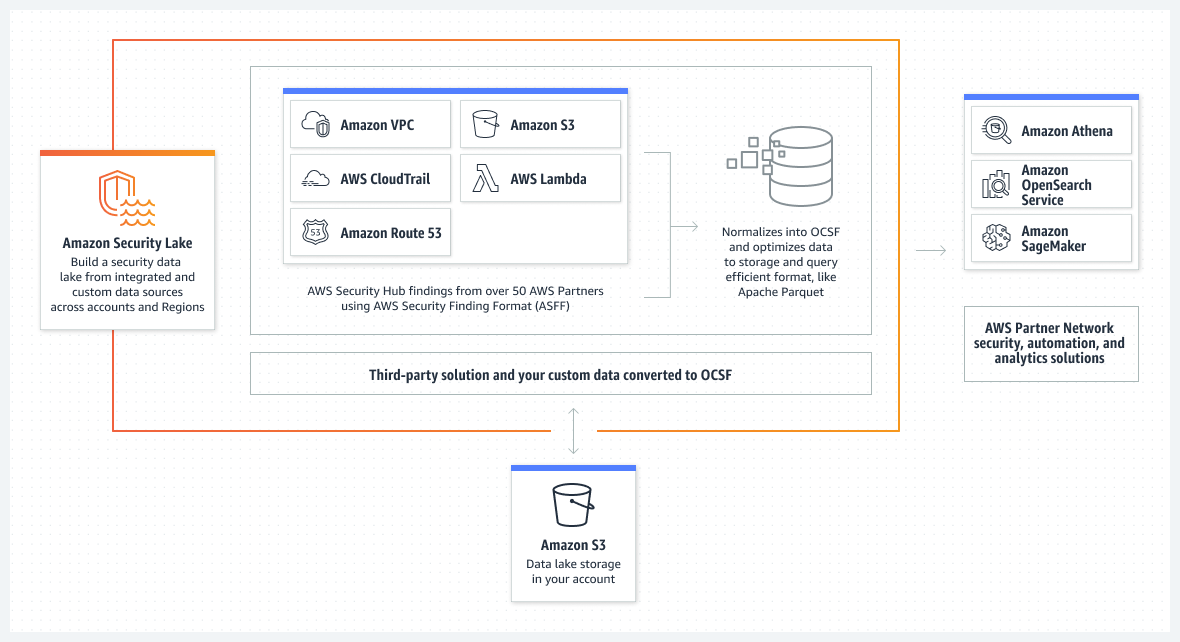
When subscribing to data access, events arrive via the Amazon Simple Queue Service (Amazon SQS). Each SQS event contains a notification object with a 'pointer' through the data used to create a URL to a Parquet object on Amazon S3. Your subscriber processes the event, analyses the data found in the object, and converts it to whatever format makes sense for your implementation.
The solution discussed in this article uses a subscriber to access the data. It's time to get into the details to learn about the implementation and understand how it all works.
Overview of the solution
The high-level architecture for integrating the Security Lake service with the OpenSearch service is as follows.
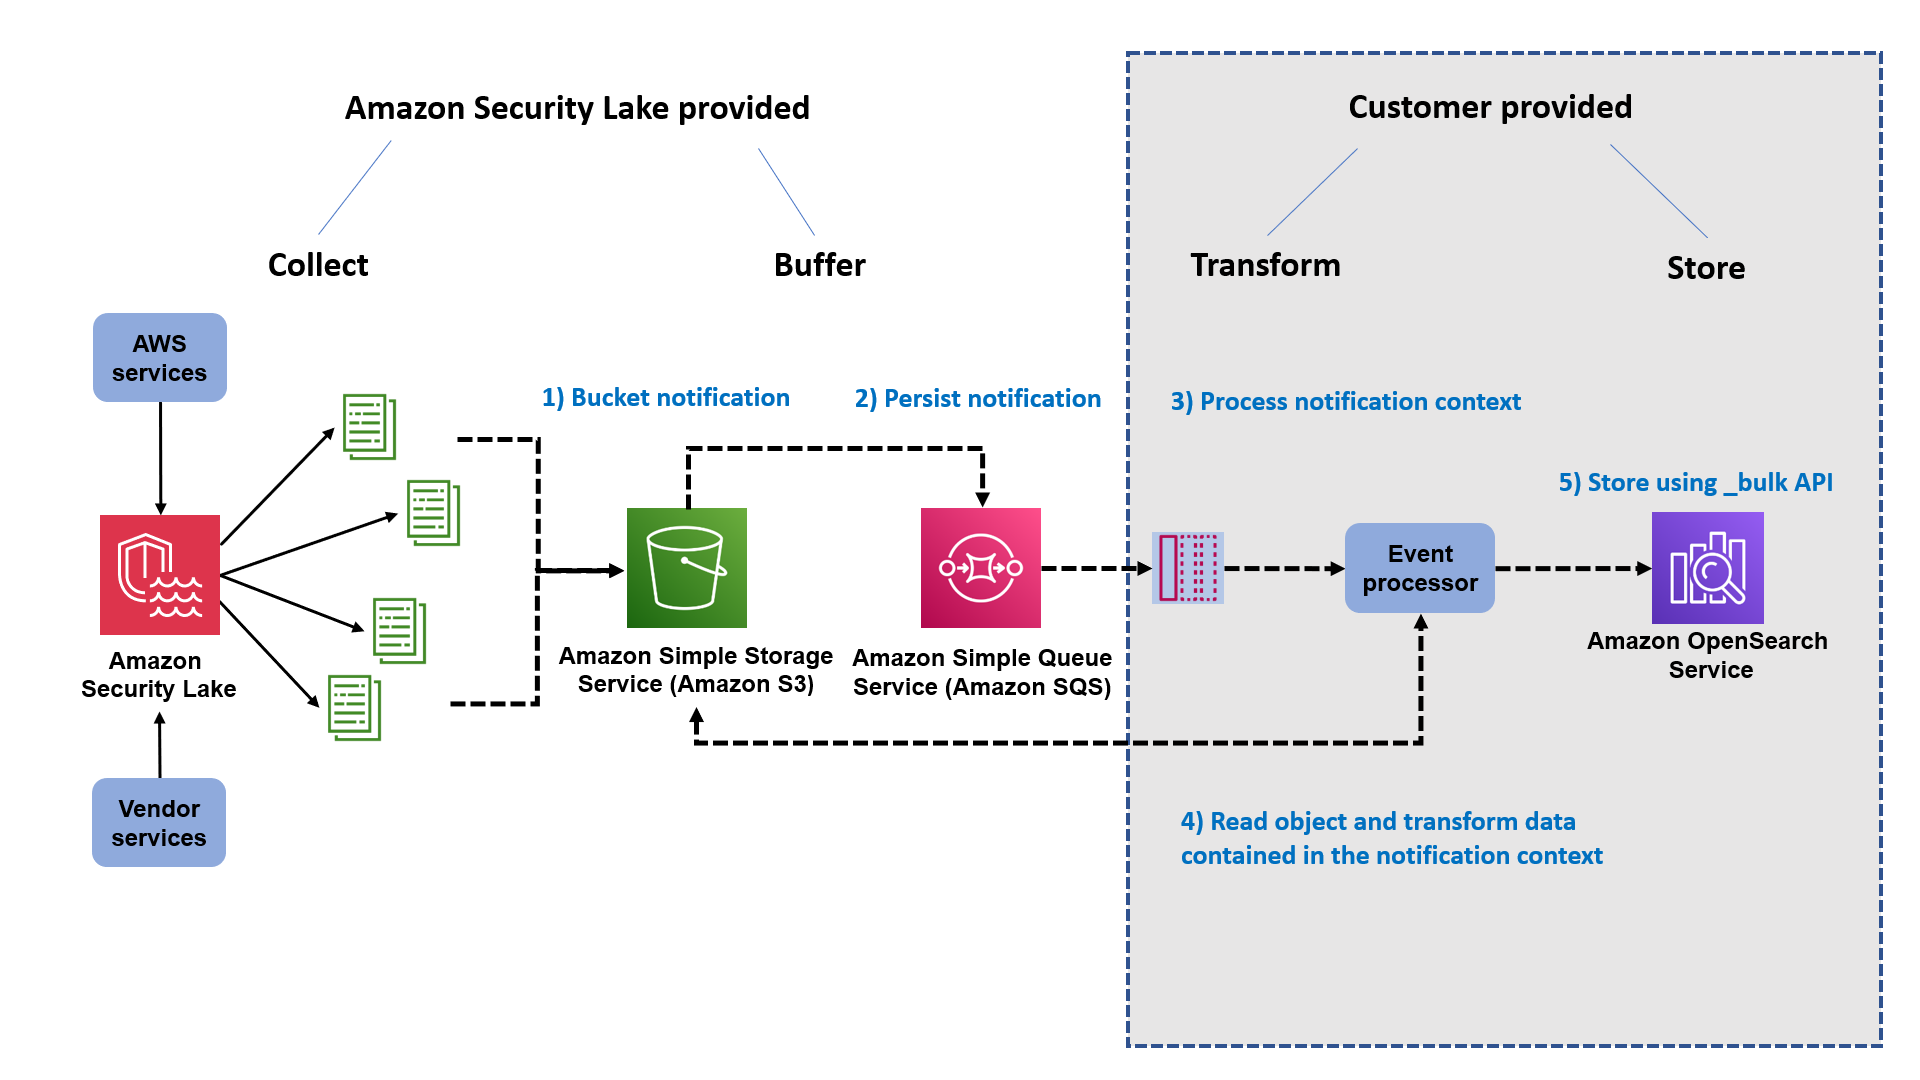
The workflow includes the following steps:
- Security Lake stores data in Parquet format in the S3 tray as determined by the Security Lake administrator.
- A notification in Amazon SQS describes the access key to the object.
- The Java code in the AWS Lambda function reads the SQS notification and prepares to read the object described in the notification.
- The Java code uses the Hadoop, Parquet, and Avro libraries to retrieve the object from the Amazon S3 service and convert the records in the Parquet object into JSON documents for indexing in the OpenSearch service domain.
- The documents are collected and sent to your OpenSearch service domain, where index templates map the structure to a schema optimized for Security Lake logs in OCSF format.
Security Lake manages steps 1-2; the client manages steps 3-5. The shaded components are your responsibility. The subscriber implementation for this solution uses Lambda and OpenSearch, and you manage these resources.
If you are evaluating this as a solution for your business, be aware that Lambda has a maximum execution time of 15 minutes at this time. Security Lake can create objects up to 256 MB, and this solution may not be effective for your company's large-scale needs. The different levers in Lambda affect the cost of the log delivery solution. So, make cost-sensitive decisions when evaluating sample solutions. This implementation using Lambda is suitable for smaller companies where the volume of logs for CloudTrail and VPC flow logs is more ideal for a Lambda-based approach, where the cost of converting and delivering logs to the Amazon OpenSearch service is more budget-friendly.
Now that you have some context, it's time to start building an implementation of the OpenSearch service!
Prerequisites
Setting up a Security Lake for AWS accounts is a prerequisite for building this solution. Security Lake integrates with your AWS Organisations account to allow you to offer selected accounts in your organization. For a single AWS account that does not use Organisations, you can enable Security Lake without the need for Organisations. You must have administrative access to perform these operations. For multiple accounts, it is recommended that you delegate Security Lake service operations to another account in your organization. See Getting Started for more information on enabling the Security Lake service on your accounts.
In addition, you may need to use the template provided and customize it for your specific environment. For this article, an example solution is access to the public S3 hosted tray, so modifications to outbound traffic rules and permissions may be required when using S3 endpoints.
This solution assumes that you are using a domain deployed in a VPC. Additionally, it assumes that you have detailed access control enabled on the domain to prevent unauthorized access to data stored within the Security Lake integration. Domains deployed by VPC are privately routable and, by design, do not have access to the public Internet. If you wish to access your domain in a more public location, you must set up an NGINX proxy to mediate requests between public and private settings.
The remaining sections in this article look at creating an integration with the OpenSearch service.
Create a subscriber
To create a subscriber, follow these steps:
- In the Security Lake console, select Subscribers in the navigation pane.
- Select Create Subscriber.
- In the Subscriber details area, enter a comprehensible name and description.
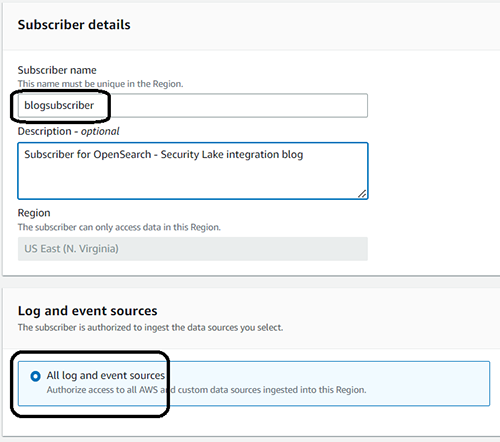
- In the Log and Event Sources area, specify what the subscriber is authorized to do. In this article, all log and event sources are selected.
- Select S3 as the Data access method.
- In the Subscriber credentials area, enter the account ID and external ID for the AWS account to which you want to provide access.
- In the Notification details area, select SQS queue.
- Select Create when you have finished filling out the form.
It will take about a minute to initialize the subscriber structure, such as the SQS integration, and generate permissions so that you can access the data from another AWS account. When the status changes from Creating to Created, you can access the subscriber endpoint in Amazon SQS.
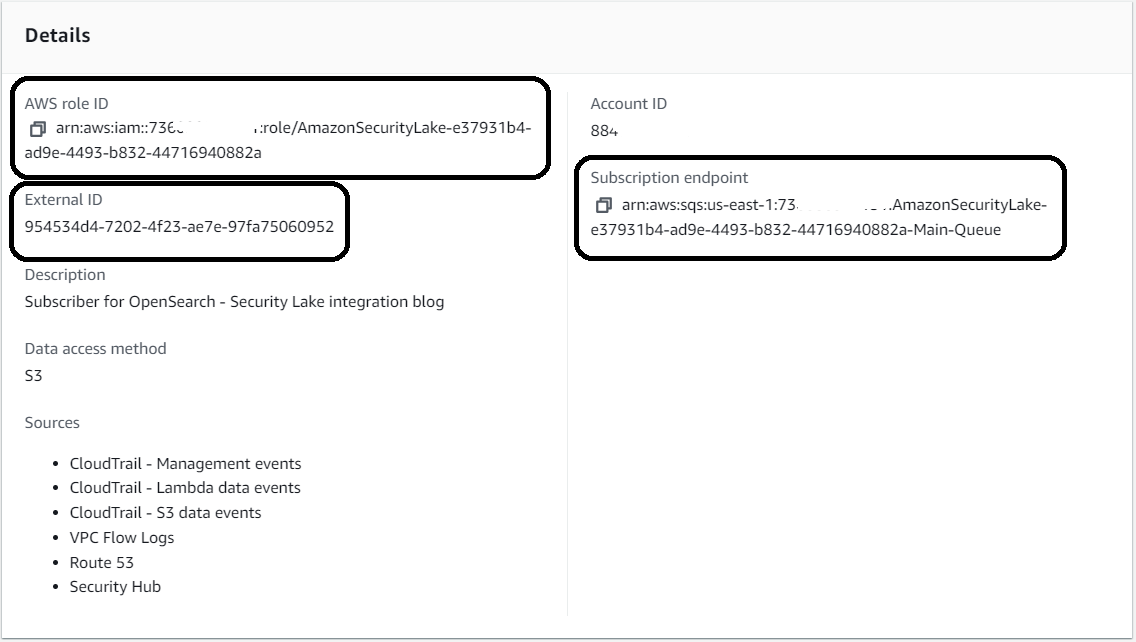
9. Record the following values found in the subscriber Details section:
- AWS role ID
- External ID
- Subscription endpoint
Use AWS CloudFormation to share Lambda integration between two services
The AWS CloudFormation template takes care of much of the integration configuration. It creates the necessary components to read data from Security Lake, convert it into JSON, and then index it in the OpenSearch service domain. The template also provides the necessary AWS Identity and Access Management (IAM) roles for the integration, tools to create an S3 tray for the Java JAR file used in Lambda's solution, and a small instance of Amazon Elastic Compute Cloud (Amazon EC2) to facilitate template provisioning in your OpenSearch service domain.
To deploy the resources, follow these steps:
- In the AWS CloudFormation console, create a new stack.
- In the Prepare template field, select Template is ready.
- Specify the template source as the Amazon S3 URL.
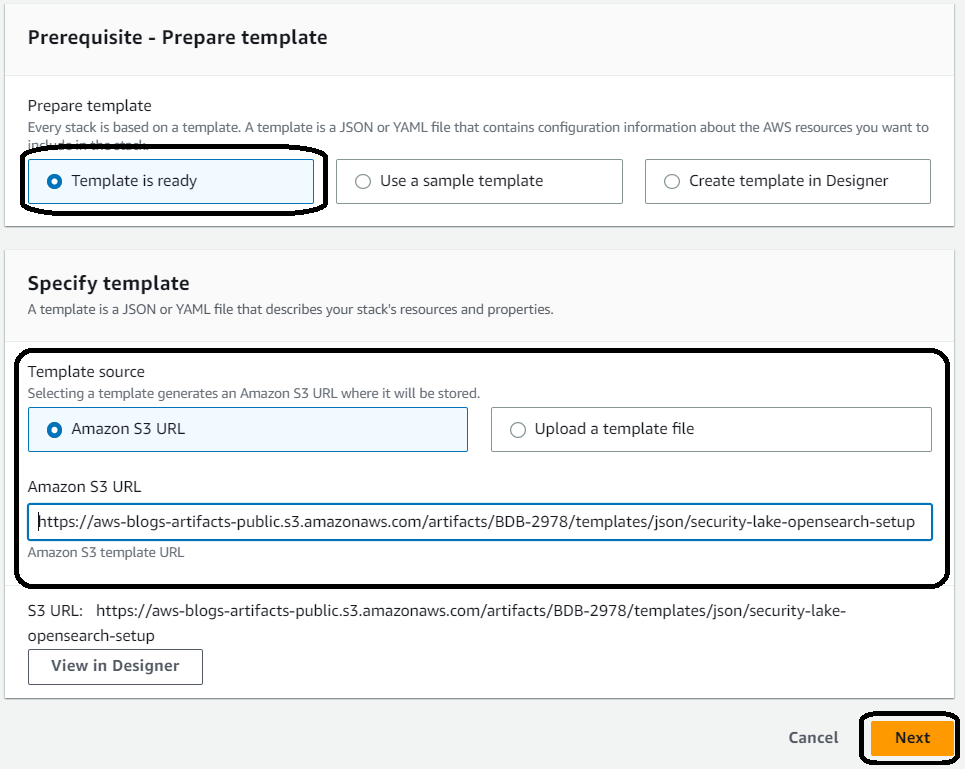
You can save the template to a local drive or copy the link for use in the AWS CloudFormation console. In this example, the authors use a template URL that points to a template stored on Amazon S3. You can use the URL on Amazon S3 or install it from your device.
- Select Next.
- Enter a name for the stack. In this article, the authors named the stack blog-lambda. Start filling in your parameters based on the values copied from Security Lake and OpenSearch Service. Ensure that the OpenSearch domain endpoint has a slash / at the end of the URL copied from the OpenSearch service.
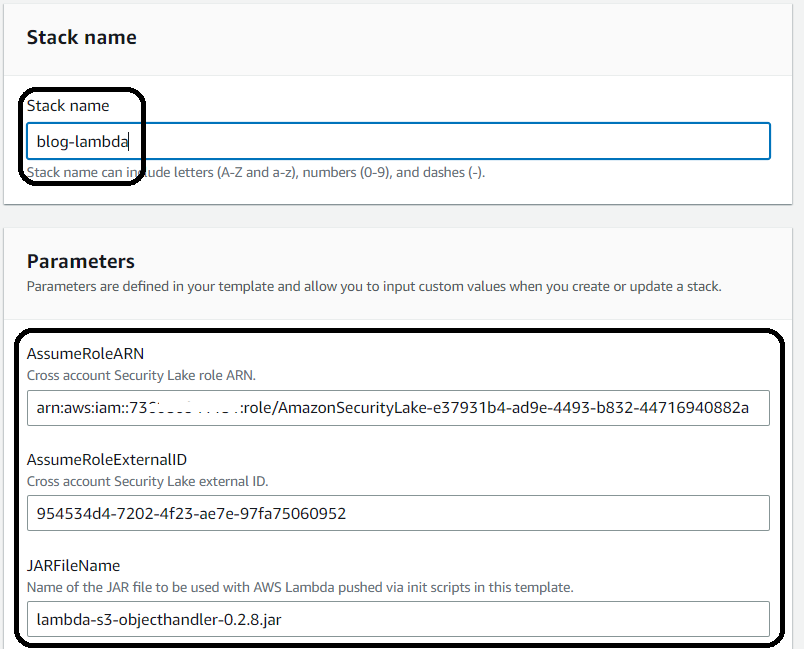
3.Fill in the parameters with the values saved or copied from the OpenSearch and Security Lake service, then select Next.
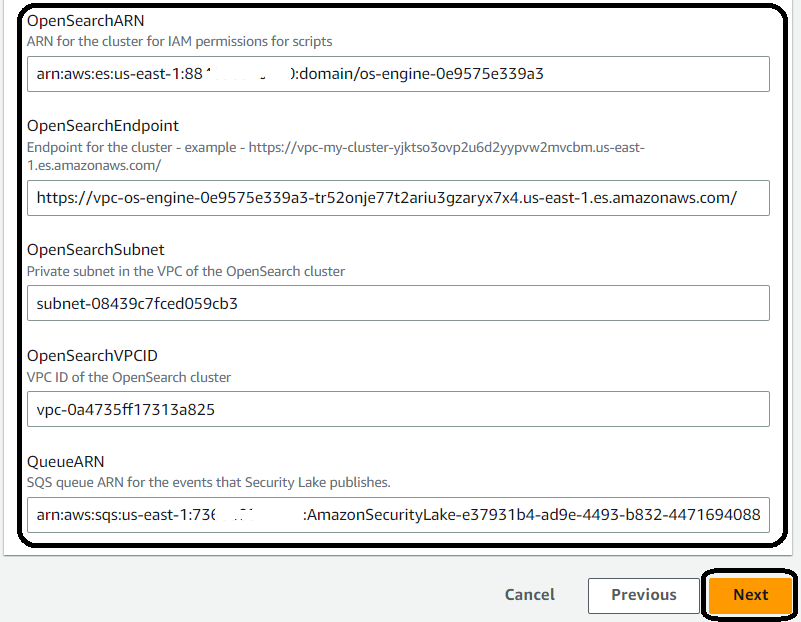
4. Select Preserve successfully provisioned resources to save resources if roles are re-purposed to debug issues.

5. Scroll to the bottom of the page and select Next.
6. On the summary page, select the checkbox to confirm that IAM resources will be created and used in this template.
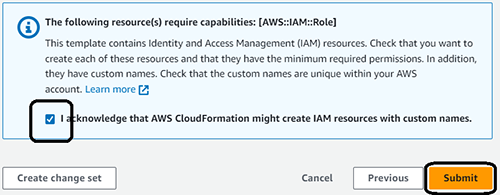
7. Select Submit.
It will take a few minutes to deploy the stack.
- Once the stack is deployed, navigate to the Outputs tab for the created stack.
- Save the CommandProxyInstanceID for scripting and save the two roles ARNs for the role mapping step.
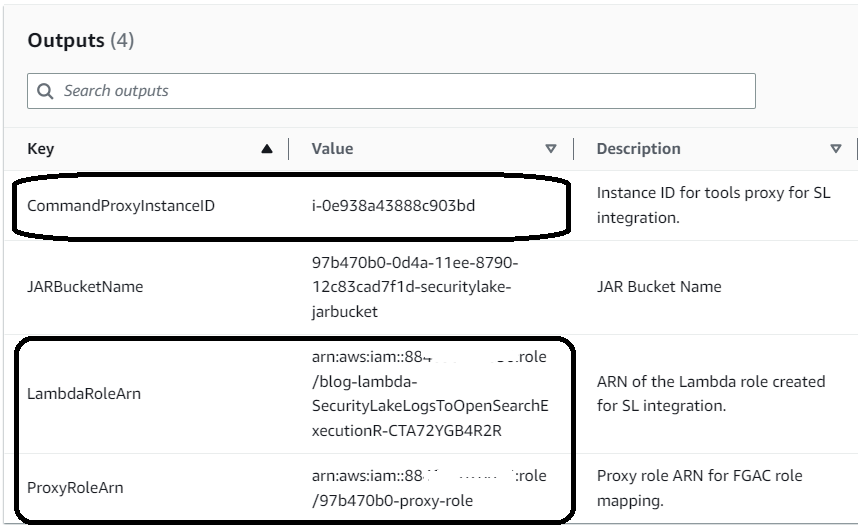
You need to associate the IAM roles for the utility instance and Lambda functions with the security roles of the OpenSearch service so that processes can interact with the cluster and its resources.
Secure role mapping for integration with the OpenSearch service
For IAM roles generated by templates, you should map the roles using the role mapping in the OpenSearch service cluster. You should specify the roles' exact use and ensure they match your company's requirements.
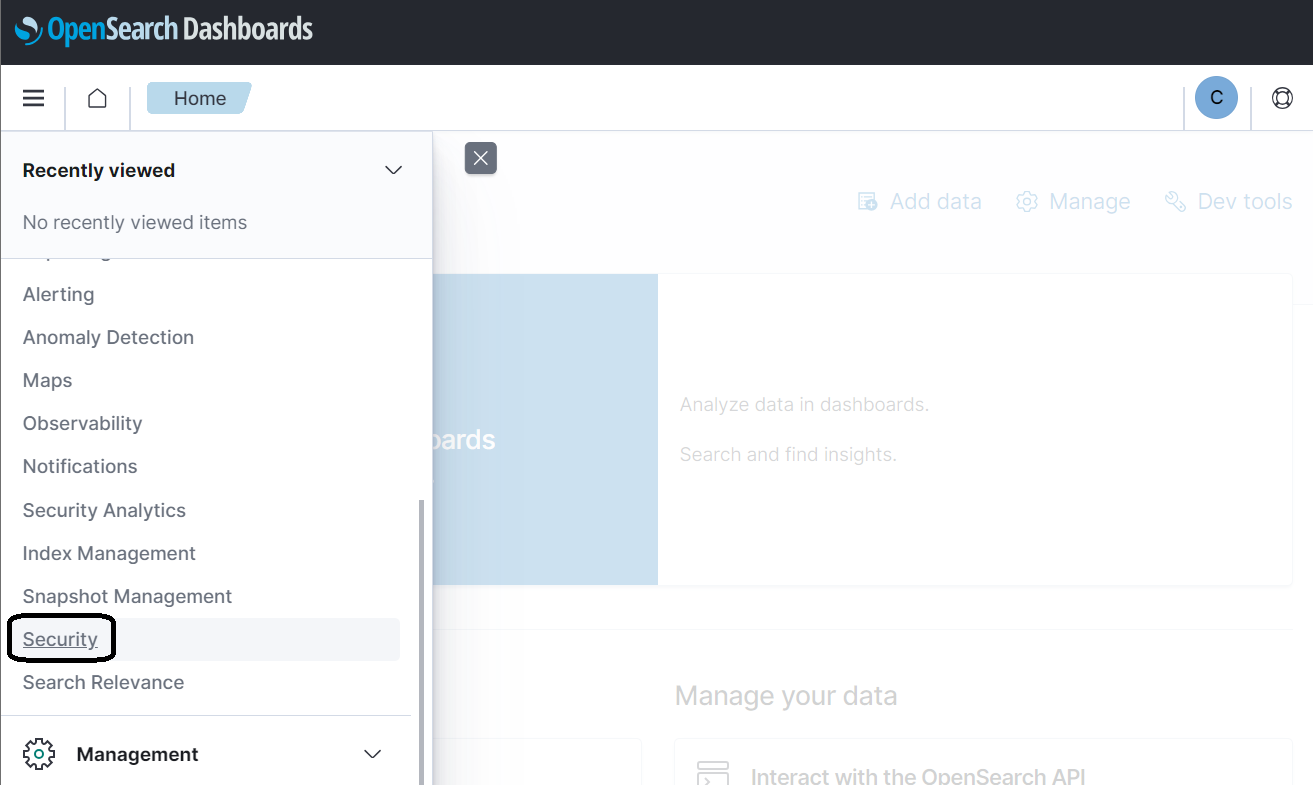
1. In OpenSearch Dashboards, select Security in the navigation pane.
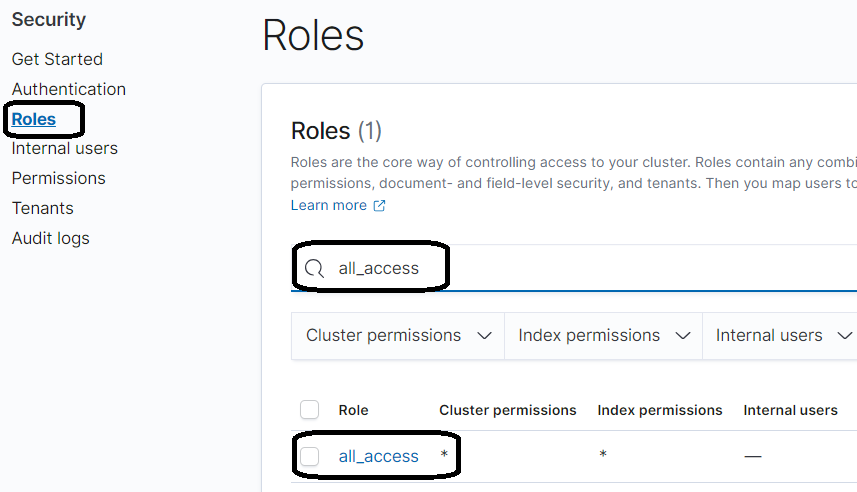
2. Select Roles in the navigation pane and search for the role all_access.
3. On the role details page, on the Mapped user's tab, select Manage to map.
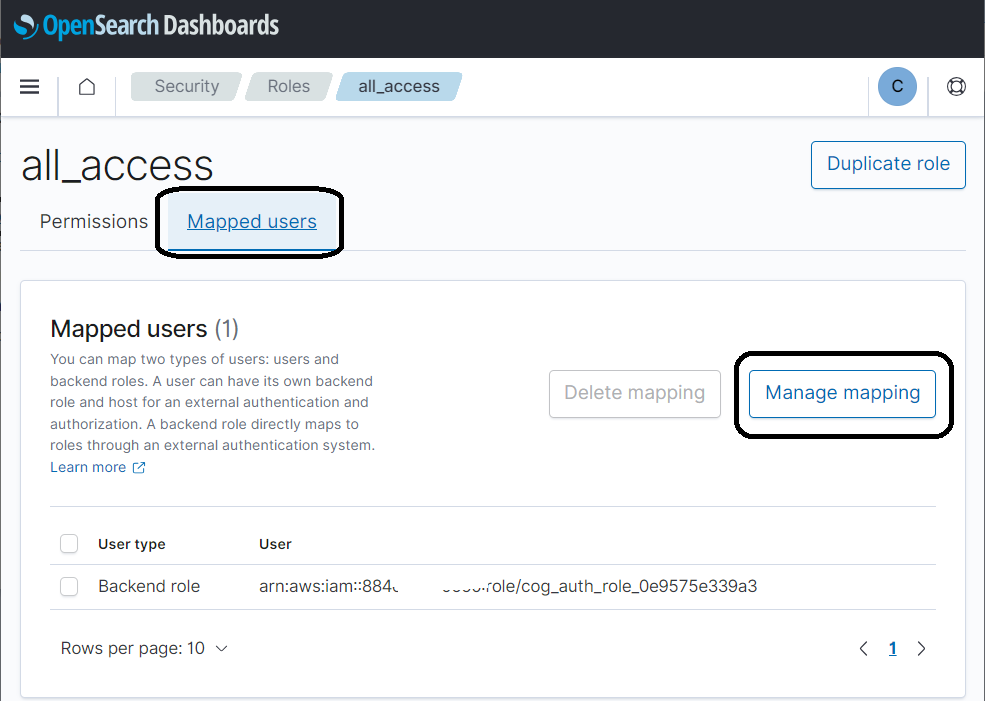
4. Add the two IAM roles found in the output of the CloudFormation template, then select Map.
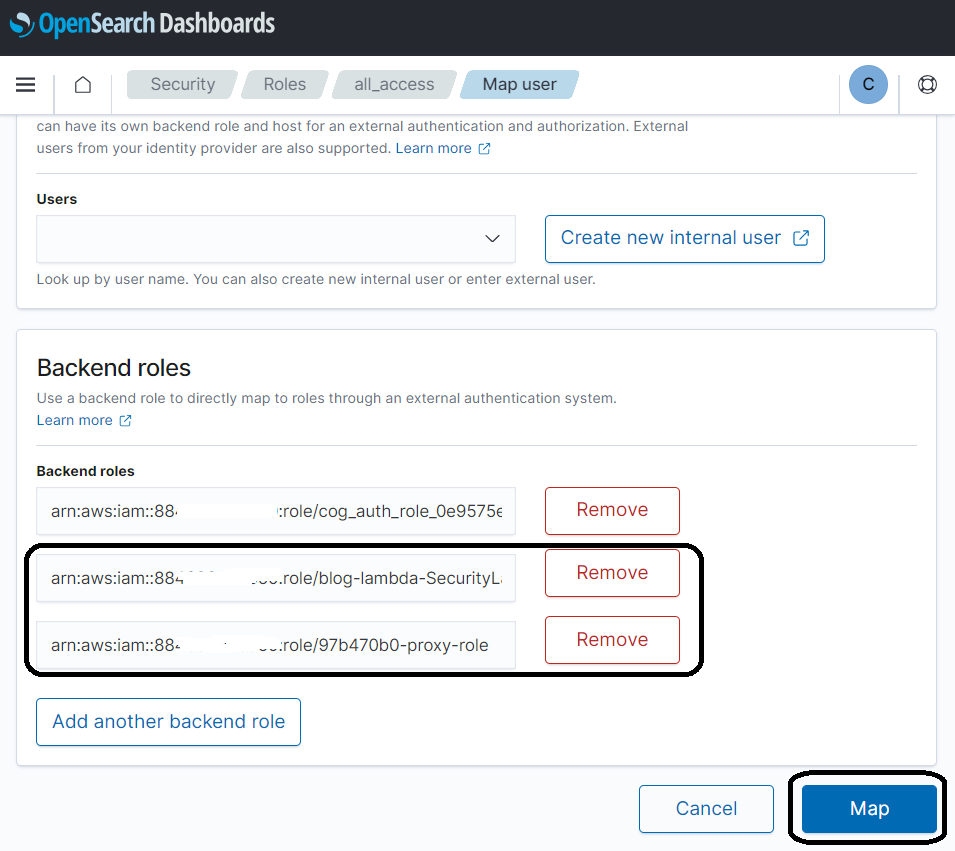
Provide the index templates used for the OCSF format in the OpenSearch service.
Index templates have been provided as part of the initial configuration. These templates are central to the data format, making sourcing efficient and suitable for aggregation and visualization. Security Lake-sourced data is converted to JSON format based directly on the OCSF standard.
For example, each OCSF category has a standard Base Event class that contains multiple objects representing details, such as the Cloud provider in the Cloud object and enrichment of data using the Enrichment object, which has a standard structure for different events but can have different values based on the event, and even more complex structures that have internal objects that themselves have more internal objects, such as the Metadata object, still part of the Base Event class. The Base Event class is the basis for all categories in OCSF and helps to correlate events stored in Security Lake and analyzed in OpenSearch.
OpenSearch is technically schema-free. So you do not need to define a schema in advance. The OpenSearch engine will try to guess the data types and mappings found in the data coming from Security Lake. This is known as dynamic mapping. The OpenSearch engine also allows predefining the data to be indexed. This is known as explicit mapping. Using explicit mappings to identify the types of data sources and how they are stored at retrieval time is critical to achieving the efficiency of retrieving large amounts of time-oriented, high-load indexed data.
In summary, mapping templates use composable templates. In this design, the solution establishes an efficient schema for the OCSF standard and allows you to correlate events and specializations into specific categories in the OCSF standard.
You load the templates using the proxy tools created by the CloudFormation template.
On the Outputs tab of the stack, find the CommandProxyInstanceID parameter.
Authors use this value to find the instance in AWS Systems Manager.
- In the Systems Manager console, select Fleet manager in the navigation pane.
- Locate and select the managed node.
- In the Node actions menu, select Start terminal session.
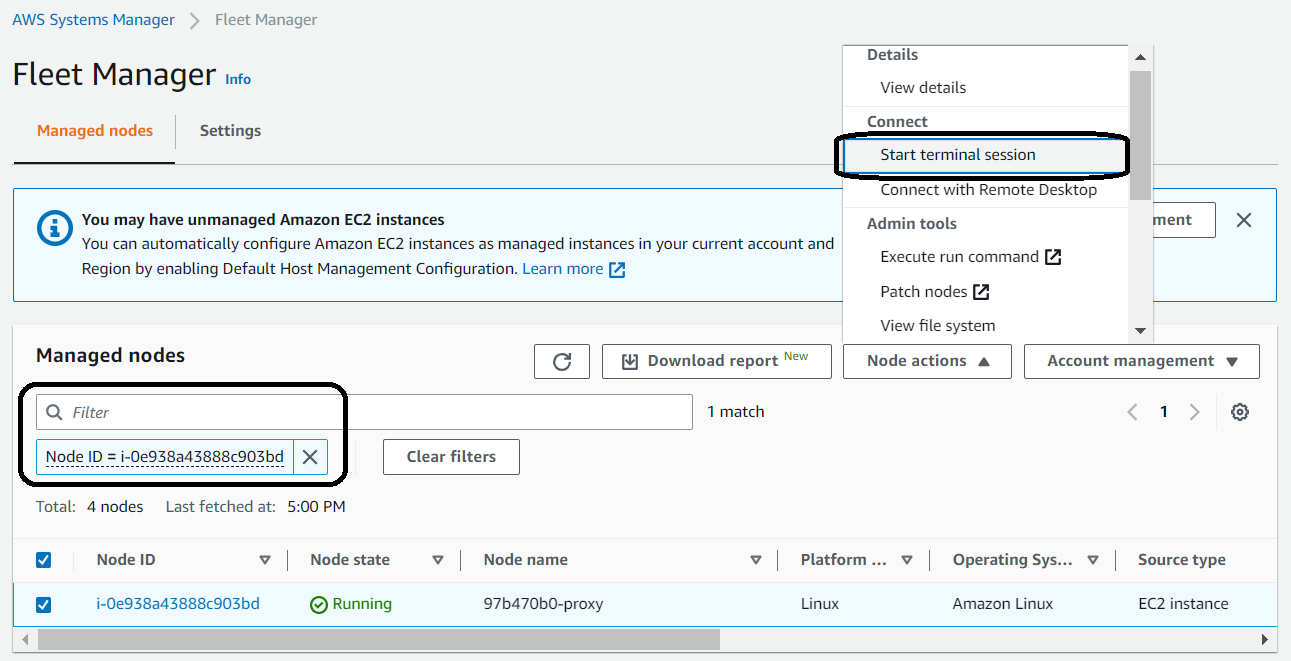
4. Once the connection to the instance has been established, run the following commands:
cd;pwd
. /usr/share/es-scripts/es-commands.sh | grep -o '{"acknowledged":true}' | wc -l

You should see a final result of 42 occurrences of {"acnowledged":true}, which shows that the commands sent were successful. Ignore the migration warnings displayed. The warnings do not affect the scripts and cannot be silenced from this point on.
Go to Dev Tools in OpenSearch Dashboards and run the following command:
GET _cat/templates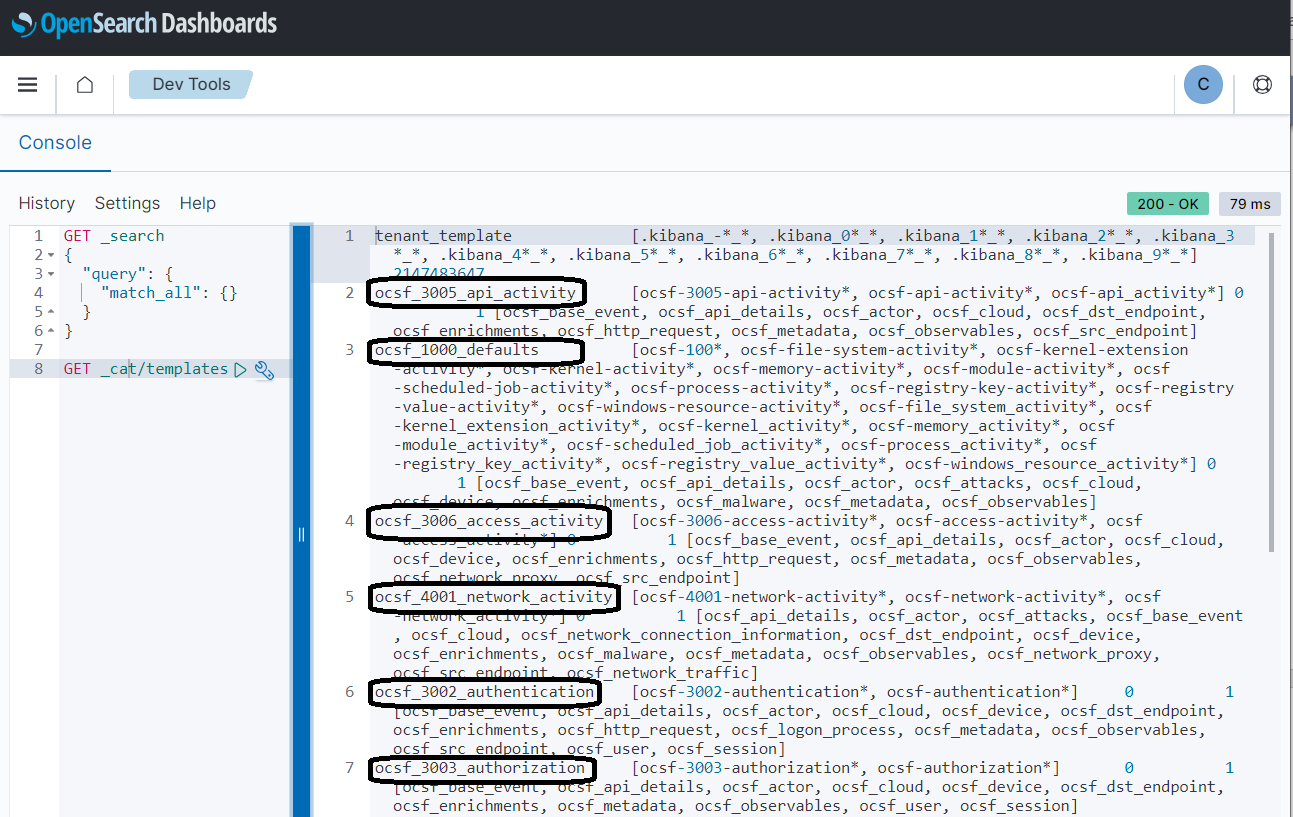
This confirms that the scripts were successful.
Install index templates, visualizations, and dashboards for the solution
The authors have prepared several visualizations for this solution to help you understand your data. Download the visualizations to your local dashboard and then follow these steps:
- In the OpenSearch Dashboards, go to Stack Management and Saved Objects.
- Select Import

3. Select the file from the local device, select the import options, and select Import.
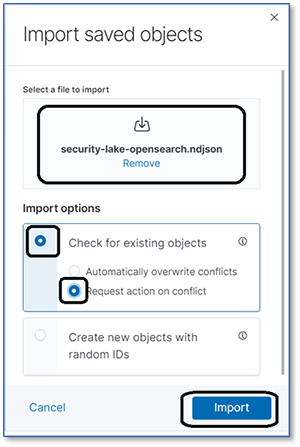
You will see several objects that you have imported. You can use the visualization once you have started importing data.
Enable Lambda to start processing events in OpenSearch.
The last step is to go to the Lambda function configuration and enable triggers so that you can read data from the subscriber framework in Security Lake. The trigger is disabled; you must allow it to and save the configuration. You will notice that the function is limited by design. You need templates in the OpenSearch cluster to index the data in the desired format.
1. In the Lambda console, navigate to your function.
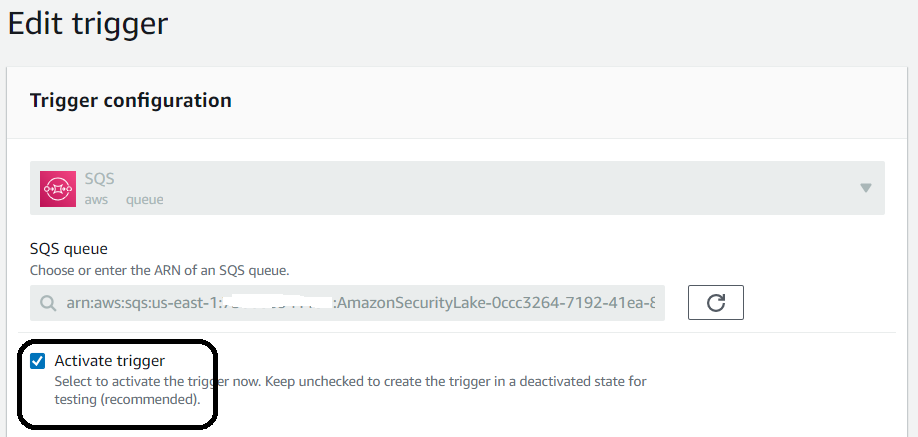
2. On the Configurations tab, in the Triggers section, select the SQS trigger and select Edit.

3. Select the Activate trigger and save the setting.
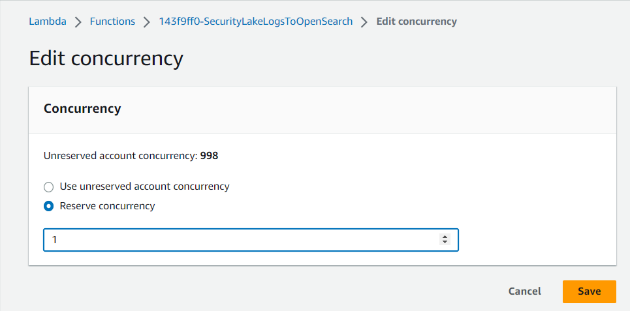
4. Select Edit concurrency.

5. Configure the concurrency and select Save.
Enable this feature by setting the concurrency setting to 1. You can adjust the setting according to the requirements of your environment.
You can view Amazon CloudWatch logs in the CloudWatch console to confirm that the feature works.
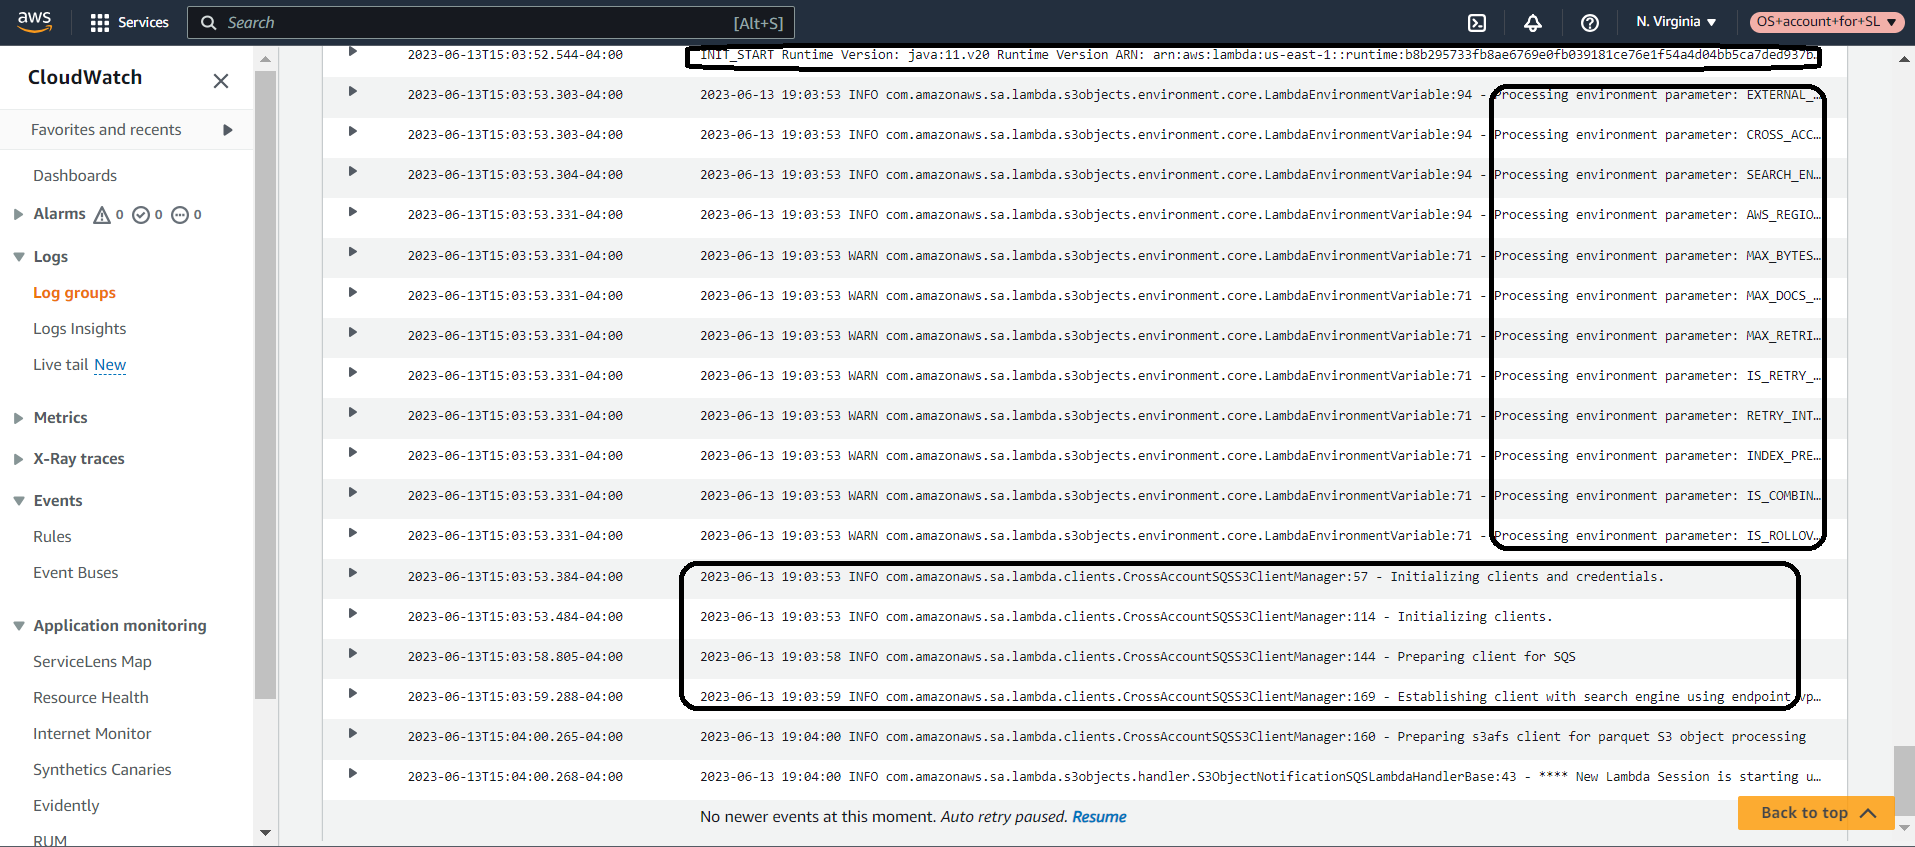
You should see startup messages and other event information indicating that the logs are being processed. The supplied JAR file is set up to log the level of information and, if necessary, an entire debugging JAR file is available for you to use to debug any issues. Your JAR file options are:
- Info-level settings for the Lambda code (default deployment) - lambda-s3-objecthandler-0.2.8.jar
- Debug-level settings for the Lambda code - lambda-s3-objecthandler-0.2.8-debug.jar
If you implement the debug version, the code detail will show some of the error level details in the Hadoop libraries. To be clear, the Hadoop code will display many exceptions in debug mode as it tests the environment settings and looks for things that are not supported in your Lambda environment, such as the Hadoop metrics collector. Most of these runtime errors are not fatal and can be ignored.
Visualize the data
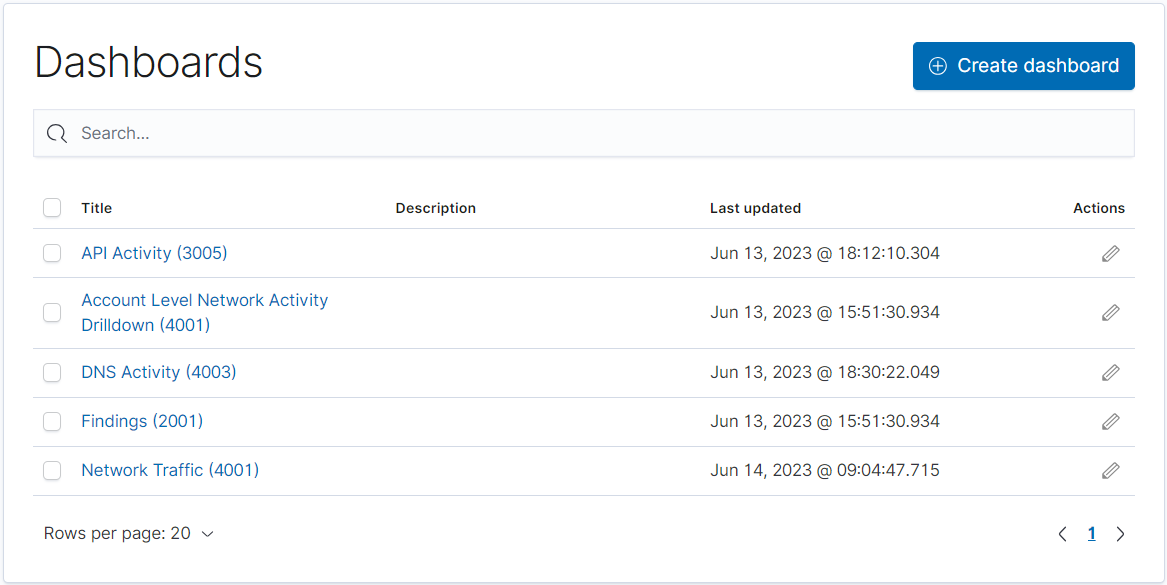
Now that the data flows into the OpenSearch service from Security Lake via Lambda, it's time to get the imported visualizations working. Go to the Dashboards page in the OpenSearch dashboards.
You will see four central dashboards arranged around the OCSF category for which they are supported. The four supported visualization categories are DNS activity, security findings, network activity, and AWS CloudTrail using the Cloud API.
Security findings
The results dashboard is a series of high-level summaries that you use to visually inspect AWS Security Hub results within the time window you specify in the dashboard filters. Many of the encapsulated visualizations allow you to filter by clicking so you can narrow down your searches. The screenshot below shows an example.
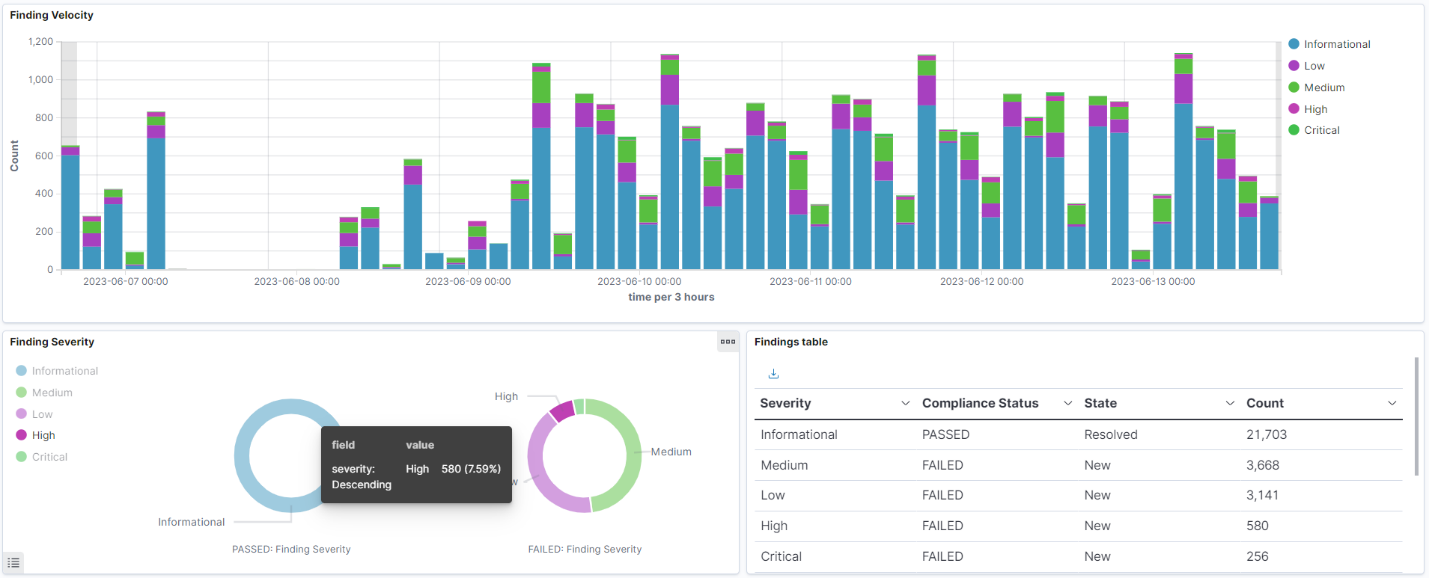
The Finding Velocity visualization shows results over time-based on severity. The Finding Severity visualization shows which 'outcomes' succeeded or failed, and the Results Table visualization is a tabular view with actual numbers. You aim to get close to zero in all categories except for informational results.
Network activity
The Network Traffic dashboard provides an overview of all accounts in the organization that have Security Lake enabled. The example below is for monitoring 260 AWS accounts, and this dashboard summarises the top accounts with network activity. The aggregated traffic, the top accounts generating traffic, and the accounts with the most activity are in the first section of the visualization.

In addition, the most important accounts are summarised by allowing and rejecting activity for connections. The following visualization contains fields that can be viewed in other visualizations. Some of these visualizations contain links to third-party sites that may or may not be allowed in your company. You can edit the links in Saved objects in the Stack Management plugin.

If you are scrambling for data, you can drill down to the details by selecting an account ID to get a summary by account. The list of outbound and inbound traffic within a single AWS account is sorted by the number of bytes sent between any two IP addresses.
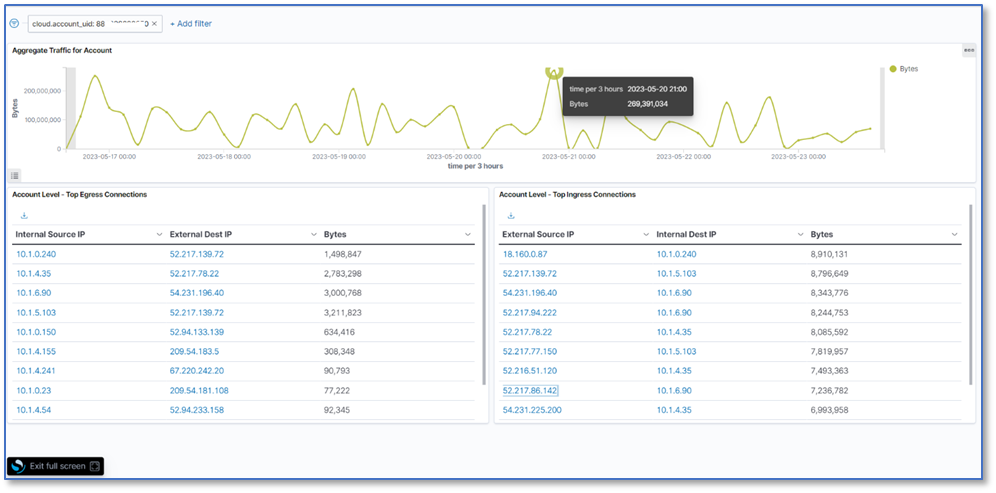
Finally, if you select IP addresses, you will be redirected to Project Honey Pot, where you can check whether an IP address is a threat or not.
DNS activity
The DNS activity dashboard shows the people requesting DNS queries on your AWS accounts. Again, this is a summary view of all events in a time window.
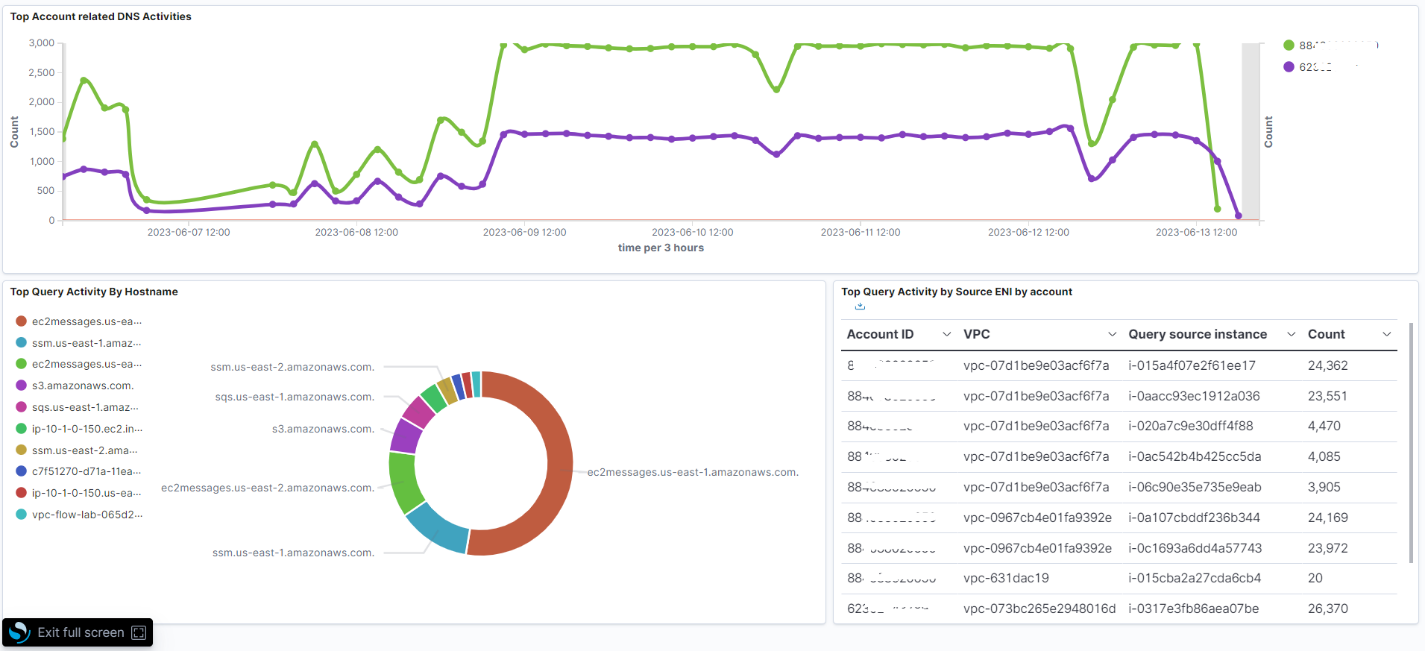
The first visualization on the dashboard shows the aggregated DNS activity across the top five active accounts. Of the 260 accounts in this example, four are active. The following visualization breaks down solutions by requesting service or host, and the final visualization breaks down requesters by account, VPC ID, and instance ID for those queries run by your solutions.
API Activity
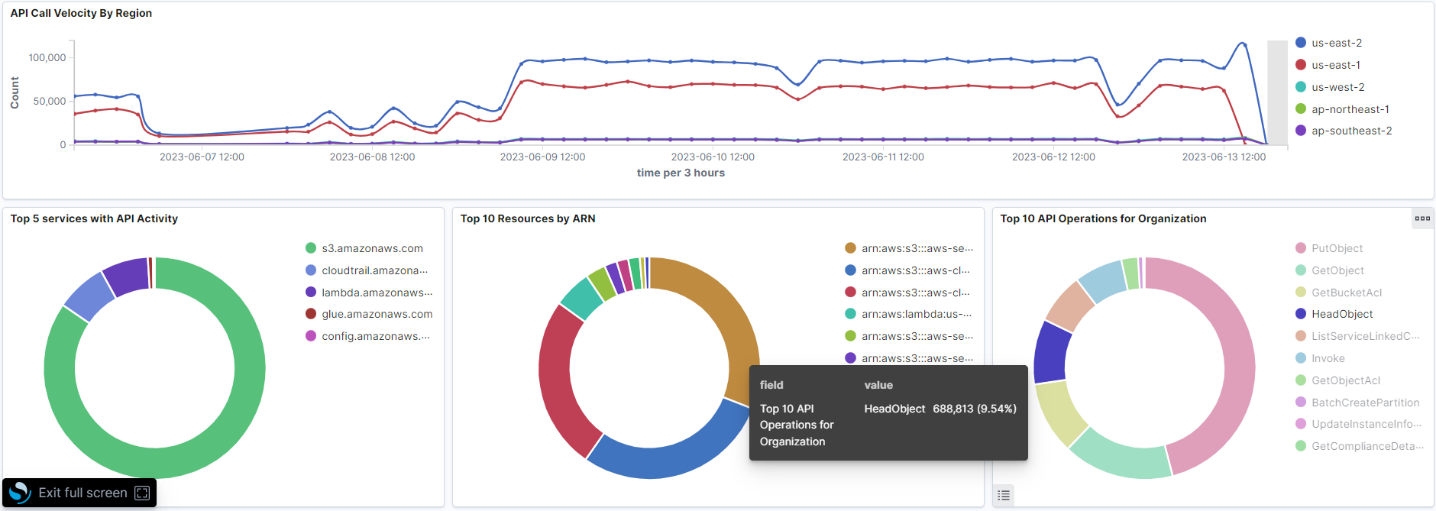
The final dashboard provides an overview of API activity via CloudTrail across all your accounts. It summarises API call rates, operations by service, critical operations, and other summary information.
If you look at the first visualization in the dashboard, you get an idea of which services receive the most requests. Sometimes, you need to understand where to focus most of your threat detection efforts based on which services may be used differently over time. Then, some heatmaps break down API activity by region and service so you can get an idea of what type of API calls are most prevalent in the accounts you are monitoring.
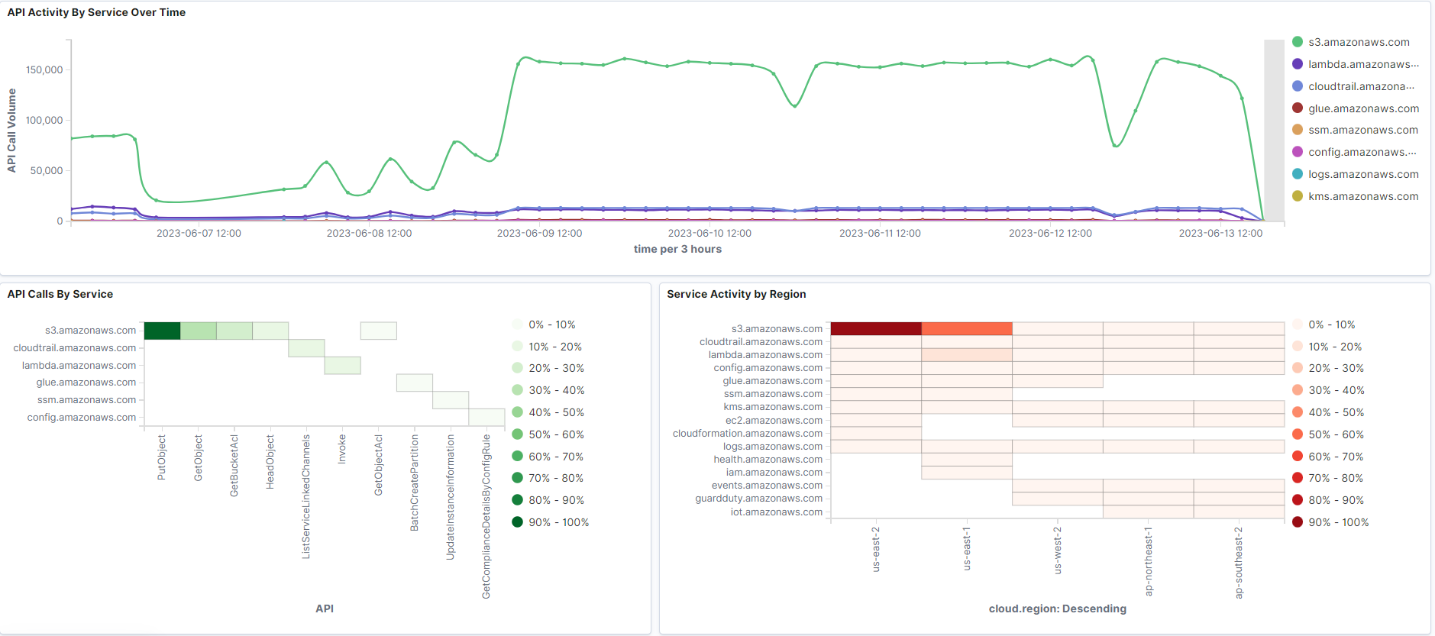
As you scroll through the form, more details appear, such as the five services with the most API activity and the most important API operations for the monitored organization.
Summary
Integrating the Security Lake service with the OpenSearch service can be done quickly by following the steps described in this article. Security Lake service data is converted from Parquet to JSON format, making it readable and searchable. SecOps teams can identify and investigate potential security threats by analyzing Security Lake data in the OpenSearch Service. The visualizations and dashboards provided can help you navigate the data, identify trends, and quickly spot any potential security issues within your organization.
As the following steps, the authors recommend using the above structure and associated templates, which provide easy steps to visualize Security Lake data using the OpenSearch Service.
In subsequent articles, the authors will review the source code and discuss published examples of the Lambda processing framework in the GitHub AWS Samples repository. The framework can be modified for containers to help companies with longer processing times for large files published to Security Lake. In addition, they will discuss how to detect and respond to security events with example implementations using OpenSearch plugins such as Security Analytics, Alerting, and Anomaly Detection available on the Amazon OpenSearch Service.


