Select, create and track entity metrics for your applications

When you operate on a variable spend model in the cloud, business growth can translate into a variable bill that reflects the activity of your workloads in your environment. For some customers, a monthly increase in their AWS bill is a normal part of growth, but it is an undesirable outcome for a significant proportion. Therefore, it is essential to use the right metrics to assess the economics of your infrastructure.
Unit metrics, defined as 'cost per business value,' allow you to measure costs in terms of the business value delivered. For example, an e-commerce company may want to know the 'cost per customer visit' or 'cost per conversion' in addition to the total bill for a cloud-based e-commerce solution, as these two business values are expected to increase. This helps to separate the impact of fluctuations in business growth from cost, providing more precise, unbiased, and insightful information. Ideally, you may want to see unit metrics fall or stay the same. Using unit metrics, you can assess how effectively your team uses technology resources, forecast future spending and investment needs, gain support, and tell your organization's IT value story. Unit metrics are also helpful tools for IT teams to communicate more effectively with their finance departments. While the specifics of unit metrics may vary from industry to industry and company to company, the methodology for selecting, calculating, and using unit metrics remains the same.
Before you start
Even if the content of this article does not require the implementation of the following, it is recommended to review the following list of implementations before proceeding:
- The CUDOS Dashboard is an in-depth, detailed, and recommendation-based dashboard that helps to delve deeper into costs and consumption. This article refers to CUDOS, which implements the ultimate dashboard. However, the solution presented here applies to any Cloud Financial Management (CFM) or Business Intelligence (BI) implementation as long as it supports Amazon Athena.
- AWS Organisations is an AWS-managed service that helps you centrally manage your organization's AWS accounts. You can still use this solution for a single AWS account, but this article aims to address organizations consisting of multiple AWS accounts.
- Resource tagging is one of the best practices for tracking and finding resources. Metadata is assigned to a resource as tags and key-value pairs. We will use tags to find business-related resources and their associated costs.
The authors of this article have chosen an example application to show how to calculate unit metrics in this article: Document Understanding Solution (DUS). This application uses AWS AI/ML, computing, databases, storage, messaging, and application services to analyze text documents. It is assumed that DUS is an API used by users who gain insights into documents through successful calls, which drives revenue. You can implement this sample application as explained (optional) or follow the instructions and apply the solution in your application. However, be aware of the costs associated with this application.
Step one: selecting meaningful unit metrics
A unit metric is a key performance indicator (KPI) consisting of a numerator that quantifies the amount of AWS spend (e.g., 'Total cost to deliver AWS value') and a denominator that quantifies the demand driver (e.g., 'X'), where 'X' is any business data that represents value to your organization; such that;
Unit Metric = Cost Data / Business Data
The denominator has a strong statistical correlation with the numerator and is a metric easily related to the represented business, financial, or end-user functions. Choosing the right measure of unit cost is the first and most crucial step. Therefore, involving business stakeholders and finance teams early helps you select the suitable unit metrics for your business.
In the DUS application example discussed, the endpoint provides value by converting documents into detailed information. 'Number of Critical Documents Analysed by Specialists' was selected as the authoritative unit metric. You can easily modify this metric to suit 'per page analyzed' or 'per 100 words analyzed'. Another unit metric used in many applications is 'Cost per Successful API response.' The API-based business parameter is more flexible and applicable to other use cases.
Step two: Locating data sources
The second step is to locate the data sources, namely, cost and business data sources, that provide input to the calculation of the unit metrics.
Cost data (counter)
Your workloads may support more than one application or be deployed in multiple environments, such as programming, testing, and production. Each application or environment may have different accounting requirements. Therefore, it is important to first separate the application's actual costs from the total AWS bill. One way to do this is to use the production environment, which is generally the main cost driver and provides business value to end users.
The process of extracting cost data is not unique to CUD applications. You can extract cost data for applications deployed on AWS using the AWS Cost and Usage Report (AWS CUR), which contains the most comprehensive set of cost and usage data. The CUR can be delivered to a specific Amazon S3 segment, hourly, daily, or weekly, depending on your choice. You can use the AWS CUR APIs to create, download, or delete CURs programmatically. If you have implemented the CUDOS dashboard as recommended before Getting Started, you would already have a CUR report in your S3 tray. Otherwise, you can create the Cost and Usage Report yourself.
Business data (denominator)
Locating business data may not be as straightforward as cost data because business data sources depend on the type of business and application. In other words, there are two common ways practiced by AWS customers:
- Programmatic queries can provide business data. Amazon CloudWatch, databases, datalakes, and storage are familiar sources of data queries for aggregated business information. These resources can be AWS resources (e.g., Amazon RDS, S3, Aurora, DynamoDB, Redshift) or external resources (e.g., JDBC).
- The manual/ad-hoc method can always be part of the process, as people may want to manually populate this data in MS Excel spreadsheets, CSV files, PDF files, presentations, etc.
The above methods are not mutually exclusive; you can use them simultaneously.
Programmatic query method: APIs are popular for sending queries to the data via SDKs, AWS CLIs or the AWS console. For example, the data could be the number of 'active users', 'sessions' or 'customer purchases' to be accessed in the database as part of a normal business process.
The example DUS application uses Amazon CloudWatch Metrics to query the 'Number of successful API calls' made to the Amazon API Gateway. Amazon API Gateway metrics were enabled to track successful API responses (e.g., with an HTTP 2XX header). If metrics were not available, a custom CloudWatch metric would be created, and the same method would be used. We used the GetMetricData API in Amazon Cloudwatch Insights to send queries on demand cost-effectively. This API is handy for occasional requests, as in this case.
The example application did not have it, but in some cases, some business data may reside in databases but not in CloudWatch. In this case, you can use AWS Lambda with Amazon Event Bridge to schedule Lambda calls and execute programmatic queries with appropriate access. You can refer to AWS Constructs to see the code templates for AWS Lambda and the data sources created for the best implementations.
Manual/ad-hoc method: you can have a specialised team manually populate business data in addition to or in parallel to the automated method. Regardless of the method used, the authors recommend extracting the business data into a file (or files) in Comma Separated Values (CSV) format, which is row-based and has native integration with commercial spreadsheet software (e.g. 'Save As' in MS Excel). A simple table schema was also used, with the first column giving the date representing the time of the business metric and the other columns giving the business values. While we developers used CSV files and a simple table to represent business metrics over time, you can use your schema and supported file formats through the Glue Crawler features.
For the example DUS application, 'Number of critical documents analysed by specialists' represents the manual method. It is assumed that the specialists compile this data after an imaginary manual step and save it in an Excel file(s).
Step three: implementation of components
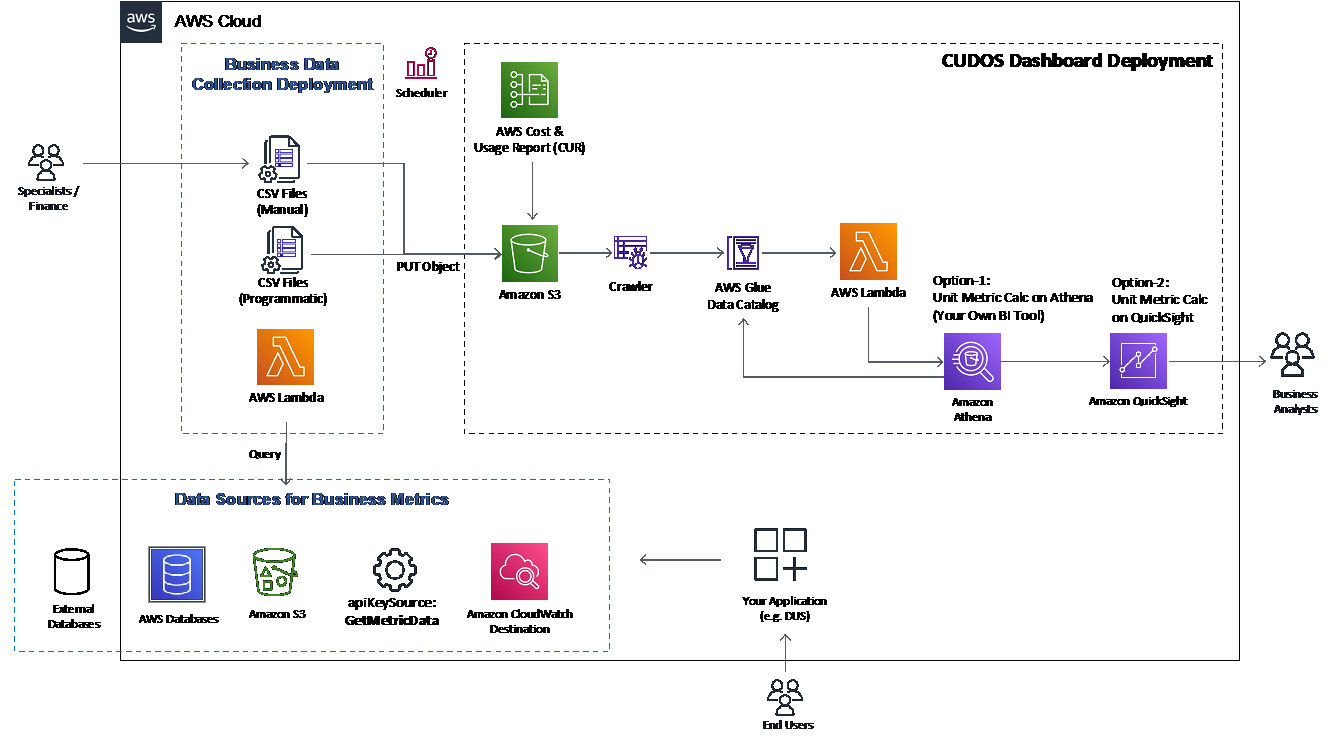
Figure 1 shows the implementation architecture. This solution has four blocks: CUDOS Dashboard, Data Sources for Business Metrics, Business Data Collection, and your application (i.e., DUS).
- The CUDOS dashboard is the starting point, as explained in Getting Started.
- Data Sources for Business Metrics contains information/data about the business value during its normal operations (e.g., number of customers, number of transactions, etc.).
- The business data collection includes AWS Lambda (executor) and Amazon EventBridge (orchestrator) to retrieve business data from the data sources for business metrics. The authors use the same AWS Lambda function to send queries from the sources and create/place CSV files in the Amazon S3 tray from the CUDOS deployment.
- Your application serves end users on AWS. In this scenario, it is a DUS application. Note that your architecture presents a clear boundary between the data sources for the business metrics and the application, which is not necessarily the case, as some or all of the data may reside in the application.

Storing business data in standard CSV files) on an S3 tray
You can start by creating an S3 tray to store your business data's CSV files, including a manually curated CSV file (e.g., business data tray).
- If necessary, an example of a manually compiled business data file (DocumentBusinessMetricsData.csv) can be found here for download. You can manually upload the object file (DocumentBusinessMetricsData.csv) to the created S3 (business-metrics-bucket); or you can use AWS Lambda and AWS EventBridge to upload business data programmatically and/or automatically. You create and upload CSV files using a different schema to experiment with.
For business metrics available in CloudWatch, you can use the AWS Lambda function to send a query to a business metric to call the GetmetricData API. As the example application (DUS) used the Gateway API, the following query was used to sum up all 'Successful API calls' from our ApiName = 'dusstack-dusapi-fqvfbqjcsj2fxh9pu242th'.
SELECT SUM(Count) FROM SCHEMA(AWS/ApiGateway, ApiName, Stage)
WHERE ApiName = 'dusstack-dusapi-fqvfbqjcsj2fxh9pu242th' AND Stage = 'prod'
Extracting CSV data into Athena tables using AWS Glue Crawler
The next step is to create an AWS Glue Crawler. Configure the S3 tray (business-metrics-bucket) as the source and then name the output table 'unitmetrics-externalsource'. You can make the robot run on demand, based on events or schedules managed by EventBridge. It is common practice to use scheduled tasks to start the entire process, starting with the visualization of the metrics as part of a business review schedule (monthly, quarterly, weekly, etc.). However, you can still run the process on-demand or event-driven based on business events, such as manually uploading a new CSV file to the S3 tray (previous step), etc.
AWS Glue Crawler runs and creates the mentioned output table (unitmetrics-externalsource) based on the uploaded CSV files.
Creation of Athena view to consolidate all data
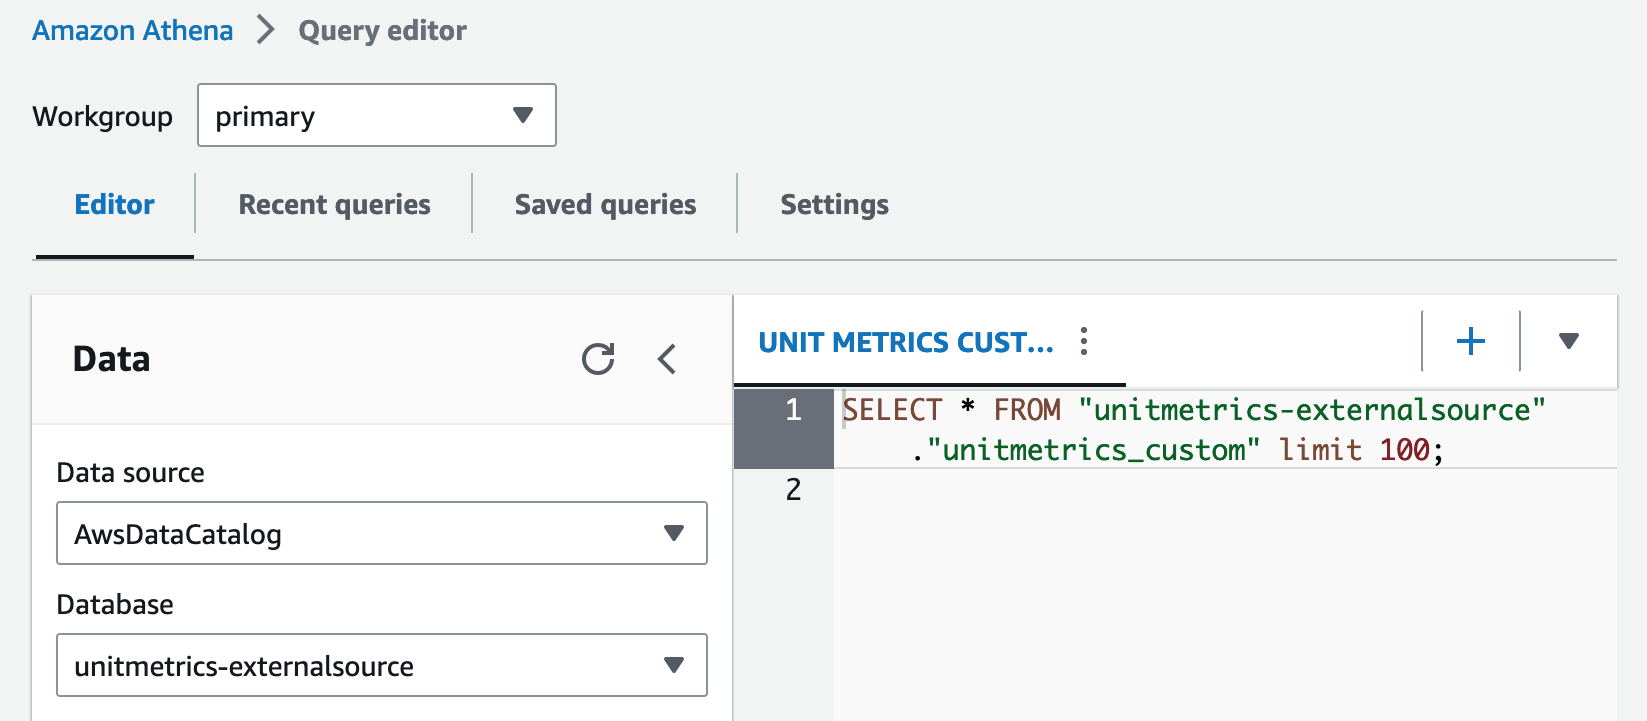
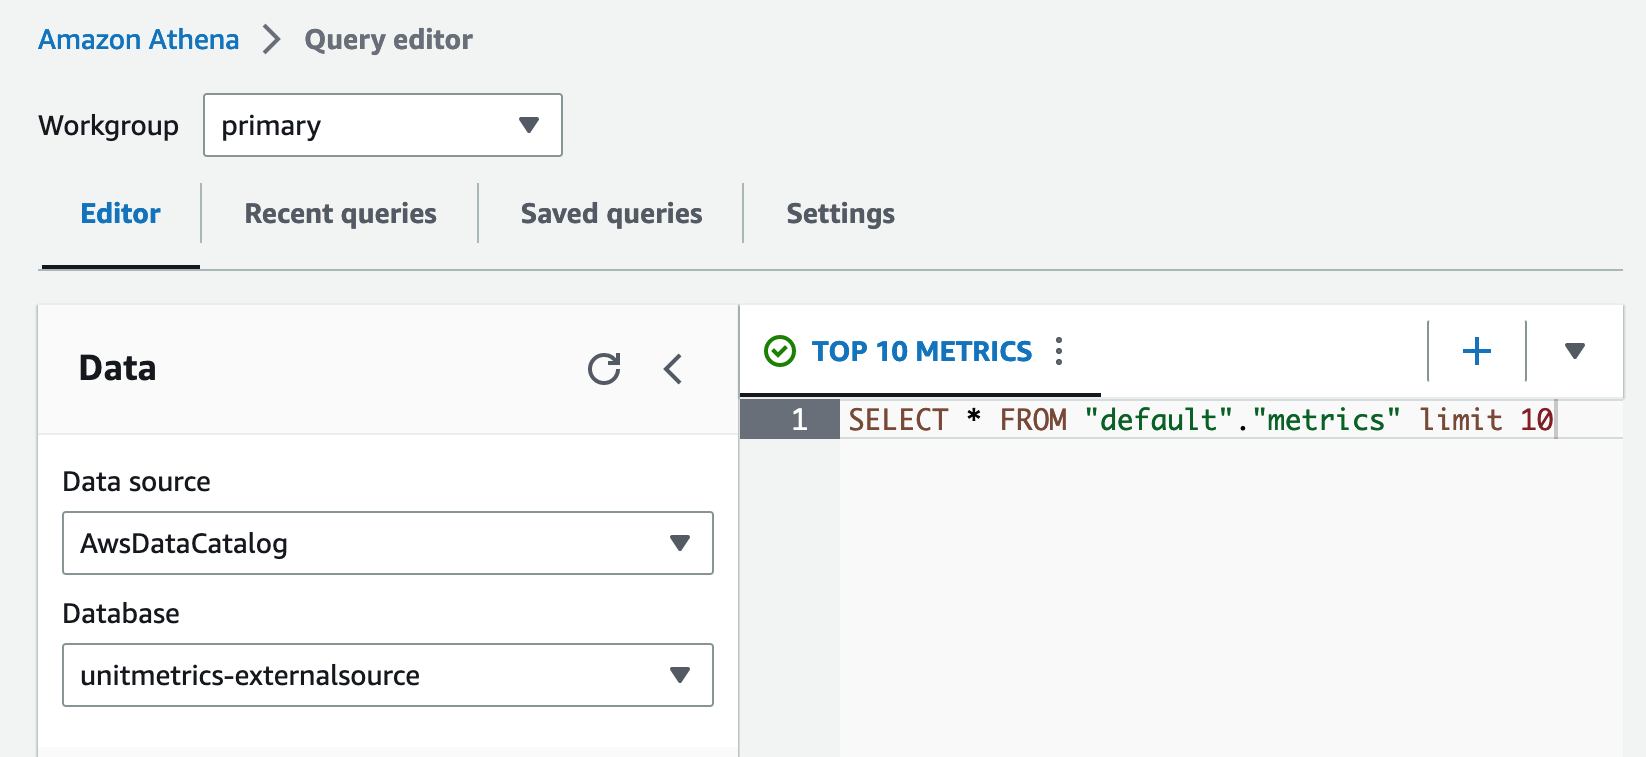
- The data sources established by the AWS Glue Crawler can be found in the Query Editor in Amazon Athena, as shown in Figures 2(a) and 2(b) below. Here, you have two data sources, one from Amazon CloudWatch cloudwatchmetrics-csv and one from external AwsDataCatalog csv files. The first should show two tables metric_samples and metrics. The second should show one unitmetrics_custom table.
- You can create an Amazon Athena View to consolidate these data sources; logical tables created by the SQL query.
- Once the view has been created, you can navigate to the Amazon QuickSight dashboard section below. If you use another BI tool, you can calculate the entity metrics in the Amazon Athena View for use in another tool.

Build the unit metrics dashboard in Amazon QuickSight
At this stage, you have already implemented the necessary tables and connectors. It is time to merge the data, calculate the unit metrics, and build the dashboard on Amazon QuickSight. To perform this step:
- First, follow the instructions on the Cloud Intelligence dashboard, in the Unit Metrics section. When selecting a dataset, select Athena and add the dataset using the 'Add dataset' option. Then, choose Athena's unitmetrics_custom view.
- Then, follow the steps described in the Customise dashboard section in the documentation to create the dashboard.
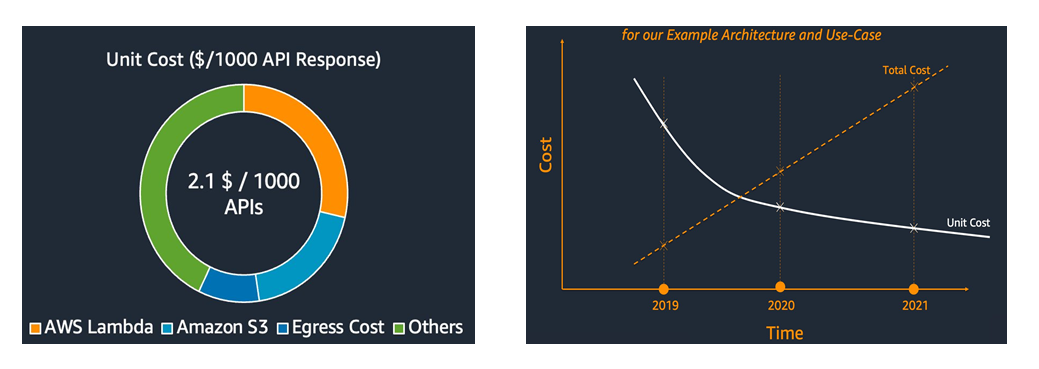
You have created two example dashboards, as shown in Figure 3.

Uninstalling the Sample Application
If you have deployed the DUS sample application, you can follow the instructions to uninstall the application.
Business interpretation of the results of unit cost metrics
Unit metrics provide valuable insights into operations, architecture, and business performance.
One of the primary uses of unit metrics is to put the total cost into context, as shown in Figure 3b. Here, you can see that the 'Total Cost' (of the application) and the 'Unit Cost' (the unit metric 'Cost of the critical document analyzed'), are shown together in a timeline graph, where the Total Cost is steadily increasing, and the Unit Cost is decreasing and beginning to converge. This is a typical pattern that helps to explain the fact that total cost depends on the efficient growth of the business (e.g., business owners can demonstrate efficiency gains through better cost control practices and economies of scale. As discussed in the series of articles on unit metrics, it is acceptable to see a temporary increase in unit cost when migrating workloads to the cloud and/or applying required application customizations (e.g., technical errors, regulatory requirements, etc.).
Another good practice is to convert the original unit cost metric (e.g., Cost per successful API response or, as in this case, $0.0021) into a more 'user-friendly/human-readable' version (e.g., Cost per 1,000 successful API responses) to display the cost breakdown, as shown in Figure 3a.
The next step would be to obtain the 'unit revenue' associated with the business drivers (e.g., 'Revenue per document analyzed'). With this information, the 'profits per transaction' can be estimated and displayed on the dashboard.
What's next?
This article describes in detail how to select, calculate, and implement a dashboard for unit metrics in AWS while providing step-by-step guidance through an example enterprise application.
As a best practice, the authors recommend that business owners establish a lifecycle management process by continually reviewing unit metrics for their applications by improving existing unit metrics (e.g., fine-tuning the numerator with a more accurate cost allocation process or increasing the correlation of the denominator with a more relevant demand driver) and/or incorporating additional metrics (e.g., analyzing sub-parts of the application or including all new applications). This enables organizations to conduct unbiased financial assessments, better understand business viability, and ultimately unlock value realization for their applications in AWS.


