
Today, millions of internet users access applications hosted worldwide in 167,000 cities served by more than 74,000 autonomous systems (ASNs). Keeping track of constantly changing network routes can be daunting for site reliability engineers (SREs), application developers, network operators, systems engineers, and cloud solution architects. With Amazon CloudWatch Internet Monitor, teams can quickly identify network issues that impact their applications' performance and availability. It offers observability and near real-time internet performance monitoring, making supporting an uninterrupted user experience easier.
Monitoring web applications can be overwhelming. When application users report negative impressions, it is often difficult to regain confidence in their capabilities. Identifying and resolving the root cause of the problem frequently requires combining data from multiple sources and third-party tools. This can be both costly and difficult, especially in time-pressured scenarios. In addition, these tools usually lack comprehensive, end-to-end information, making it difficult to pinpoint the exact location of the problem. Internet Monitor simplifies this process by quickly narrowing down the scope of the problem. It helps teams quickly identify and fix issues disrupting user experience.
Notes on scaling with Amazon CloudWatch Internet Monitor
Internet Monitor monitors application internet traffic across all locations where customers access application resources, including their access via ASNs and city networks for application traffic. The cost of the first 100 city networks is included in the price of the service. To control expenses when increasing the number of city networks, you must set thresholds for internet traffic. This is done by determining the percentage of internet traffic per number of city networks for each monitor. This limit can be adjusted based on your desired service level objectives (SLOs). Please note that you will only be charged for the number of city networks you monitor up to the predetermined limit.
The price of the Internet Monitor service consists of three components: a fee for the monitored resource, a fee for the city network, and fees for the diagnostic logs published in CloudWatch logs. For a detailed breakdown of these charges, see the CloudWatch price list.
Setting up application monitoring
The authors assume you can configure Amazon Virtual Private Cloud (VPC), Amazon CloudFront distributions, and Amazon WorkSpace catalogs. In this article, they will focus on Internet Monitor's operational efficiency, considering its cost-effectiveness and business objectives. They will also explore the trade-offs between cost and traffic coverage when setting a higher maximum limit for city networks. They will discuss detailed user experiences of configuring and implementing operational best practices for Internet Monitor, including cost estimates. Finally, they compare scenarios with a 1:1 ratio of monitors to resources with a 1-to-many ratio, discussing the advantages of each approach.
The authors demonstrate Internet Monitor's capabilities using a typical use case. They refer to the fictional start-up ABC. ABC's core application provides an interactive video service. In this scenario, ABC has identified its most extensive user base in densely populated urban areas. ABC wants to monitor its users' internet traffic. ABC's video service is hosted in a virtual private cloud (VPC) and distributed to users via CloudFront distribution.
The developers will provide step-by-step instructions for setting up the monitor and offer recommendations to help achieve the ABC video service's goals. They will use Internet Monitor to understand the traffic and ISPs serving ABC users' connections.
To get started, create a monitor in the Internet Monitor console.
Step 1: Create monitor
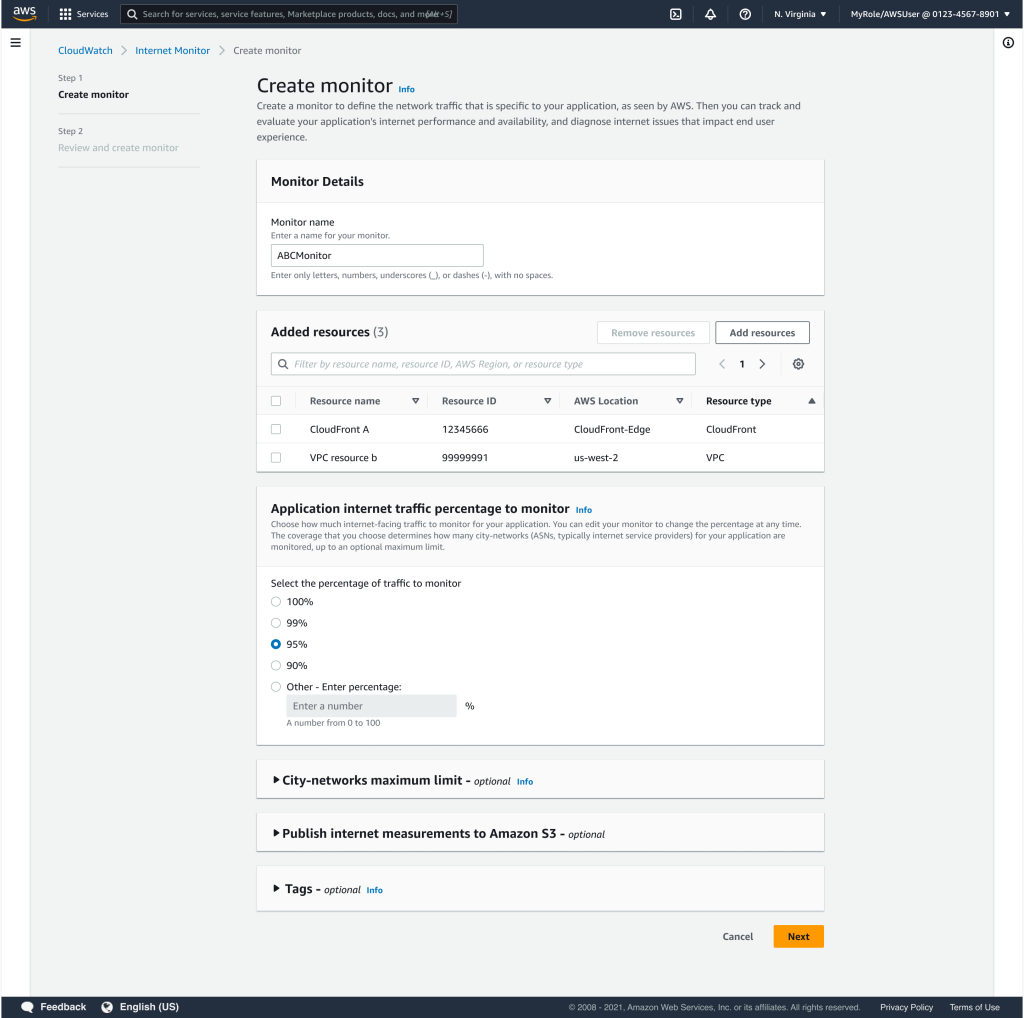
On the Create monitor page, enter the monitor name "ABCMonitor". Select "Add resources" to search for VPC and CloudFront resources. Enter "VPC resource b" and "CloudFront A" in the Added resources field. Select the relevant resources from the search results. Click "Add resources".
Under "Application internet traffic percentage to monitor", specify the percentage of application traffic to monitor. If you are unsure, you can start with 95% by selecting the radio button for the traffic percentage, as shown in Figure 1. Internet Monitor will sort by traffic volume, covering the most important ASNs.
Step 2: Monitor Dashboard
After a few days, the observed traffic is displayed for 95% of the total traffic, as shown in Figure 2.
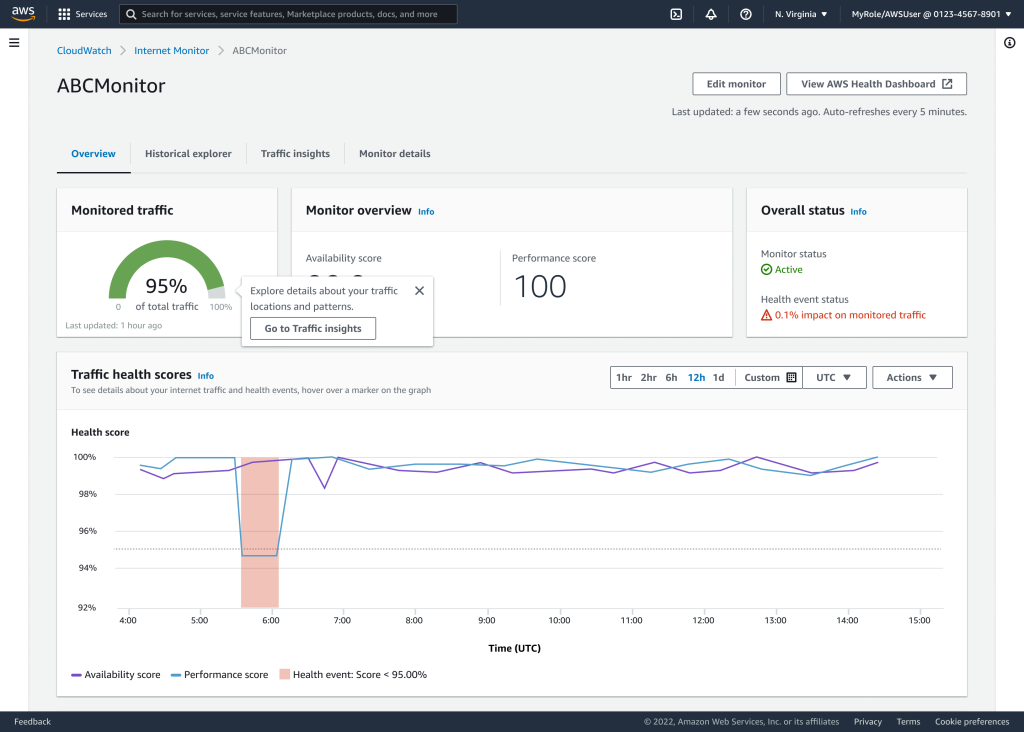
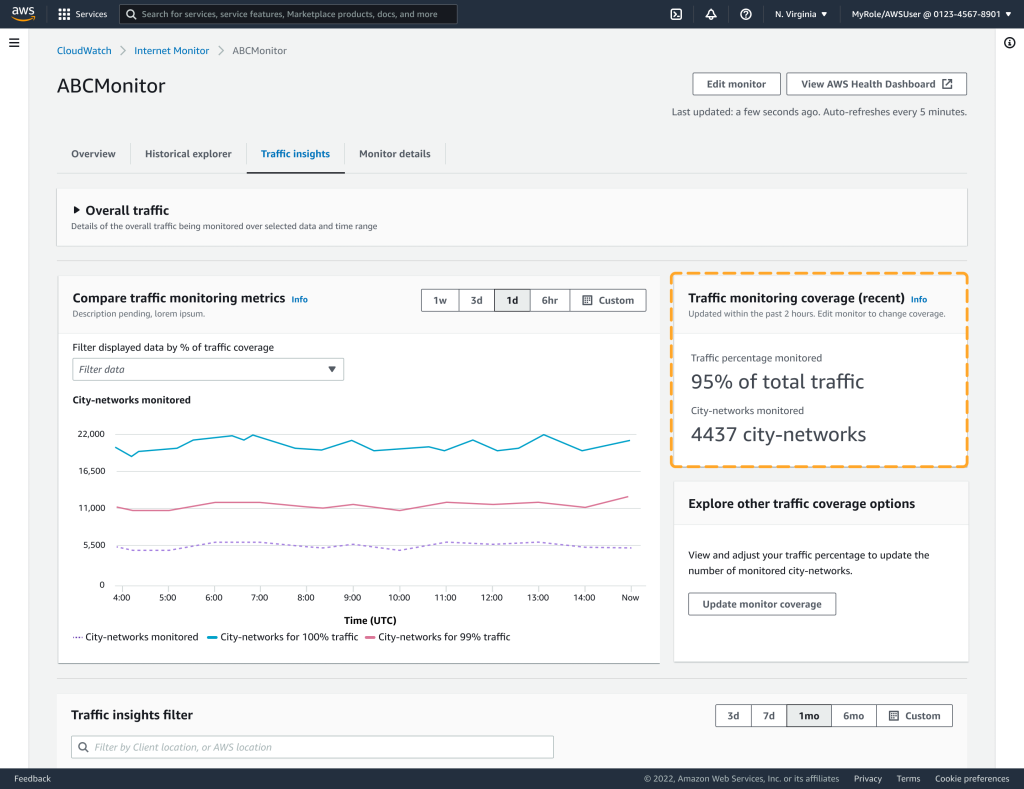
Click 'Go to traffic statistics' in the Monitored Traffic widget to learn more about traffic coverage, as shown in Figure 3.
Step 3: Review and tune Traffic Insights
The Traffic Information tab displays the item 'Traffic monitoring coverage (recent),' as indicated by the dotted lines in Figure 3. It has the percentage of monitored traffic: 95% of total traffic, corresponding to 4437 monitored city networks. If you were previously unsure what percentage of traffic to monitor, you now have an insight into the number of monitored city networks with 95% traffic coverage.
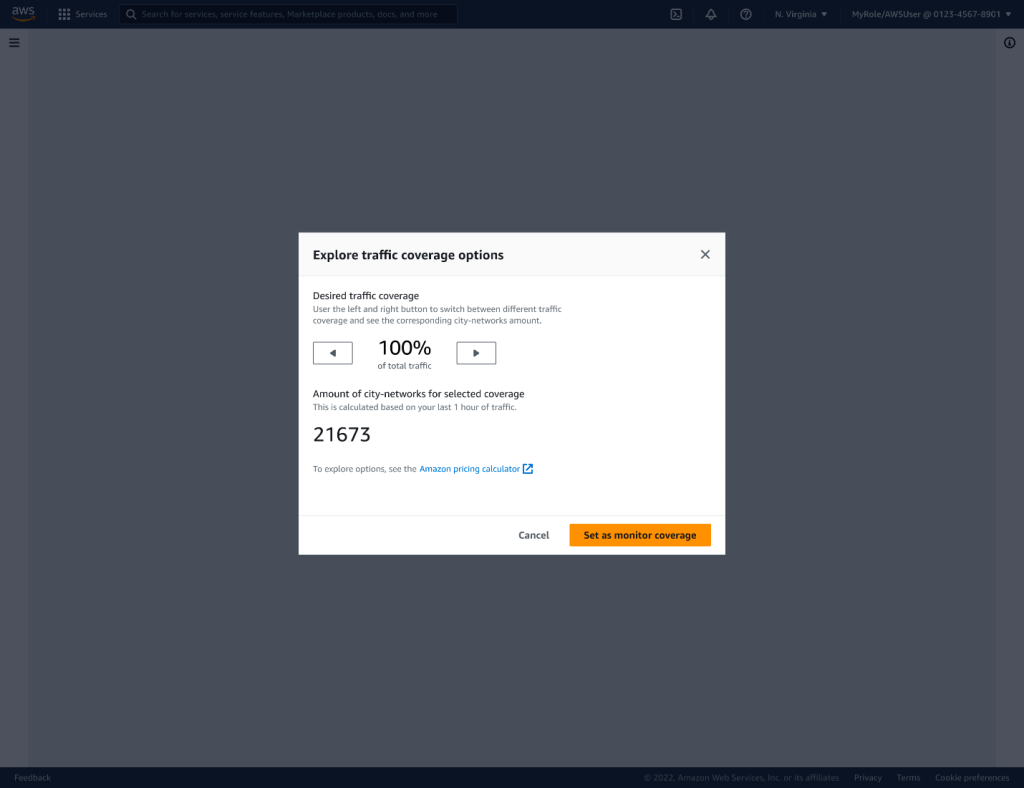
You can now investigate alternative traffic coverage based on the observed traffic patterns. You can increase or decrease the percentage of traffic coverage in "Explore traffic coverage options." In the ABC example, when the traffic coverage increases to 100%, the number of city networks is 21,673, as shown in Figure 4.
Time to look at the cost of monitoring 95% vs 100% traffic.
Assume us-east-1 region
Monitored resources:
Number of VPCs: 1
plus CloudFront distributions: 1
Total resources = 2
Multiply by $0.01 ($0.01 /hr) = $0.02/hr
Multiply by 730 (hrs/month) = $14.60
Cost for monitored resources = $14.60 / month
City-networks:
Total city-networks monitored: 4437
Subtract 100 (the first 100 city-networks are included) = 4337
Multiply by $0.000074 = 0.3209380
Multiply by 730 (hrs/month)= $234.28
Cost for city-networks = $234.28/month
CloudWatch Logs:
Internet Monitor publishes events to CloudWatch Logs for a maximum of 500 city-networks. We also assume the following:
* Each event will use 1MB of space per city-network per day.
* Cost is $0.50/GB
* 5GB is included per month in CloudWatch Logs, so we subtract $2.50/month
500 city-networks x 1 MB/ city network = 500 MB/day
We want to arrive at $/month, therefore:
(500 MB/day) x (730 hours/month) x (1 day/24 hours) x ($0.50/GB) x (1 GB/1000 MB) = $7.60/month
Subtract $2.50 = $5.10
Cost for CloudWatch Logs = $5.10/month
The total cost for ABC Company is $14.60 + $234.28+ $5.10 = $253.98/month
In CloudWatch Metrics, you can also see the Internet Monitor metrics for ABC's application:
CityNetworksMonitored 4437
TrafficMonitoredPercent 95
CityNetworksFor100PercentTraffic 21673
Currently, the TrafficMonitoredPercent is 95%. Internet Monitor calculates the number of city networks based on current traffic patterns. It includes all city networks with the highest percentage of total traffic, up to 95%. In the ABC scenario, if the capacity requirement of the application is higher than 95%, 100% coverage is a better risk-averse decision. The remaining 5% of traffic from unmonitored city networks would not provide performance, availability information, or health alerts. So you can increase monitoring of 100% of ABC's global application internet traffic. To do this, refer to the CityNetworksFor100PercentTraffic metric, which shows a corresponding city-network count of 21673. Before you do this, however, you should review the estimated monthly costs associated with monitoring 100% of traffic before you do this.
Monitor Costs for 100% of traffic
Assuming us-east-1 region
Monitored resources: The number of monitored resources has not changed, so the cost is still $14.60/month.
City-networks:
Total city-networks monitored: 21673
Subtract 100 (the first 100 city-networks are included) = 21573
Multiply by $0.000074 = 1.59
Multiply by 730 (hrs/month)= $1165.37
Cost for city-networks = $1165.37/month
CloudWatch Logs
Internet Monitor publishes events in CloudWatch logs for up to 500 city-networks. The cost has already been included in the estimate for 95% of the traffic. Therefore, the cost would remain unchanged at $5.10 per month, as we saw in the previous example. Taking all expenses into account, including the cost of monitoring traffic to 100%, the total monthly cost for ABC to effectively monitor its entire user base is US$1185.07 per month.
ABC's total cost is USD 14.60 + USD 1165.37 + USD 5.10 = USD 1185.07/month
Step 4: Edit Monitor application traffic percentage
Once you have completed your cost analysis and determined a better percentage for your use case, increase or decrease the coverage and click the 'Set as monitor coverage' button to set the desired value.
Step 5: Review Traffic Insights
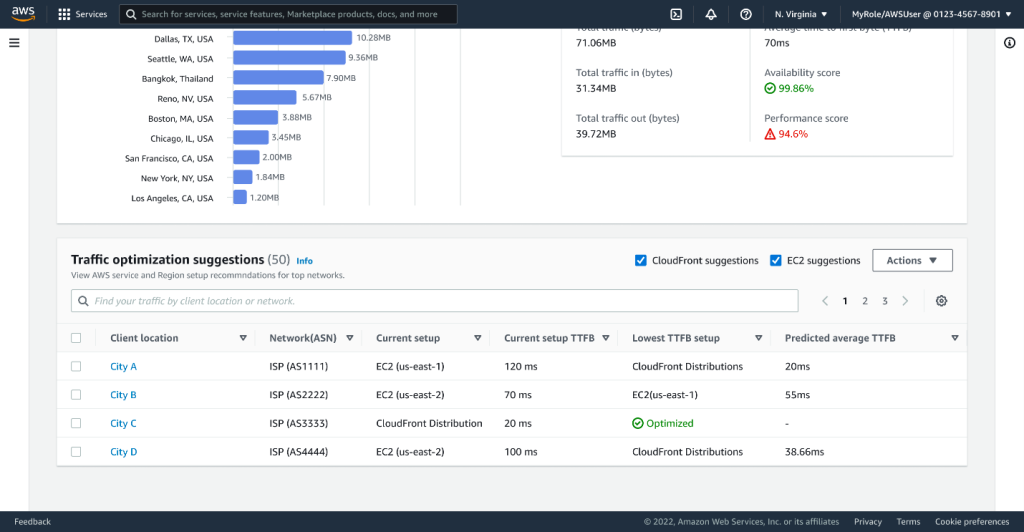
After changing the coverage percentage, it is important to review the result of the change. Use the Traffic Information tab to identify any network degradation issues. If the Traffic Statistics filter contains entries suggesting that some users are experiencing network degradation problems, you can take action on the suggested solutions. As an example in Figure 6, the suggestions for optimising traffic are as follows:
For City A, implementing CloudFront distribution could result in a predicted average TTFB (time to first byte) of 20 ms, compared to the current TTFB of 120 ms.
For City B, moving to the us-east-1 region could result in a predicted average TTFB of 55 ms, as opposed to the current configuration of 70 ms using us-east-2.
City C is already optimized.
Implementing the CloudFront distribution for city D could result in a predicted average TTFB of 38 ms, compared to the current TTFB of 100 ms.
You can implement these traffic statistics suggestions to improve the TTFB for the ABC service.
How many monitors should be created?
Creating one monitor for the VPC and CloudFront resources in the ABC Company scenario was sufficient. However, there are several options for deploying monitors, each with its own set of advantages:
The best practice is to have a dedicated monitor for each application to facilitate the distribution of metrics per application. Customers who prioritize redundancy and convenience opt to create at least two monitors for all their resources.
For customers looking for redundancy at a lower cost, there is the option of creating a separate monitor for each region.
Summary
You can use Amazon CloudWatch Internet Monitor to monitor traffic and the Monitor Overview to view traffic health results (availability and performance results). You can view detailed location information and traffic patterns by clicking Traffic Statistics. You can increase the coverage of monitored traffic so you do not miss critical information from unmonitored traffic. In this scenario, ABC decided to improve traffic monitoring to 100%. They received traffic information and suggested actions to mitigate any degraded user experience.
Conclusions
Monitoring Internet applications can be difficult due to the complex path of packets between users and applications. Internet Monitor simplifies the identification of network degradation experienced by application users. Internet Monitor filters relevant internet measurements from data collected by AWS, enabling you to identify and resolve internet issues. This article describes how you can monitor application traffic and obtain the traffic information necessary to support application users cost-effectively.


